



Maze Station
An experimental VR environment that investigates how disrupted circulation, altered proportions, and sequential visual cues influence spatial cognition. Based on the layered flows of Taipei Main Station, the maze transforms transit logic into an experiential study of wayfinding and disorientation.

2024.11-12 Individual work
TYPE: Individual project — Academic
INSTRUCTOR: Li-Wen Sung
KEYWORDS: Systems thinking; spatial modeling; XR experience design
TOOLS: Rhino; Grasshopper; Autocad; Space Syntax; Unity; Blender; Meta Quest 3; Photoshop
Observation:
Everyday Chaos at Taipei Main Station
Taipei Main Station is a multi-layer transit hub — TRA, THSR, Airport MRT, Metro Red & Blue lines, intercity buses — surrounded by malls and underground corridors. It concentrates diverse users and conflicting activities into tight circulation spaces, creating constant moments of hesitation, crowding, and sensory overload.

Everyday scenes at Taipei Main Station – tourists hesitating at exits, commuters queuing, staff under pressure. The same space compresses very different tasks and emotional states.
Flows, Friction, and Overload
Taipei Main Station behaves less like a single station and more like a stacked system of multiple infrastructures. Within one connected structure, it hosts:
Taiwan High Speed Rail Taiwan Railways
Taipei Metro (Red / Blue lines)
Taoyuan Airport MRT
Taipei Bus Station & intercity coaches
Underground malls (K、Y、Z zones)
Dispite being physically connected, these systems were designed at different times, by different agencies, with different signage logic. As a result, passengers experience:
long walking distances,
multi-source crossing flows,
inconsistent wayfinding,
and extremely high cognitive load—especially for tourists, seniors, and accessibility users.
1-1
Why Navigation Fails Here
Despite being a single “station,” Taipei Main Station behaves like five buildings stacked together. The spatial system generates long transfers, multi-source passenger flows, and large cognitive load, especially for tourists and accessibility users.
Taipei Main Station handles more than twice the ridership of any other station—making navigation errors far more consequential.
Six transit systems converge here, creating multiple passenger origins and conflicting circulation flows inside the same corridors.
The same station generates entirely different cognitive loads: a first-time visitor needs 14 minutes, while a commuter only needs 6 minutes.
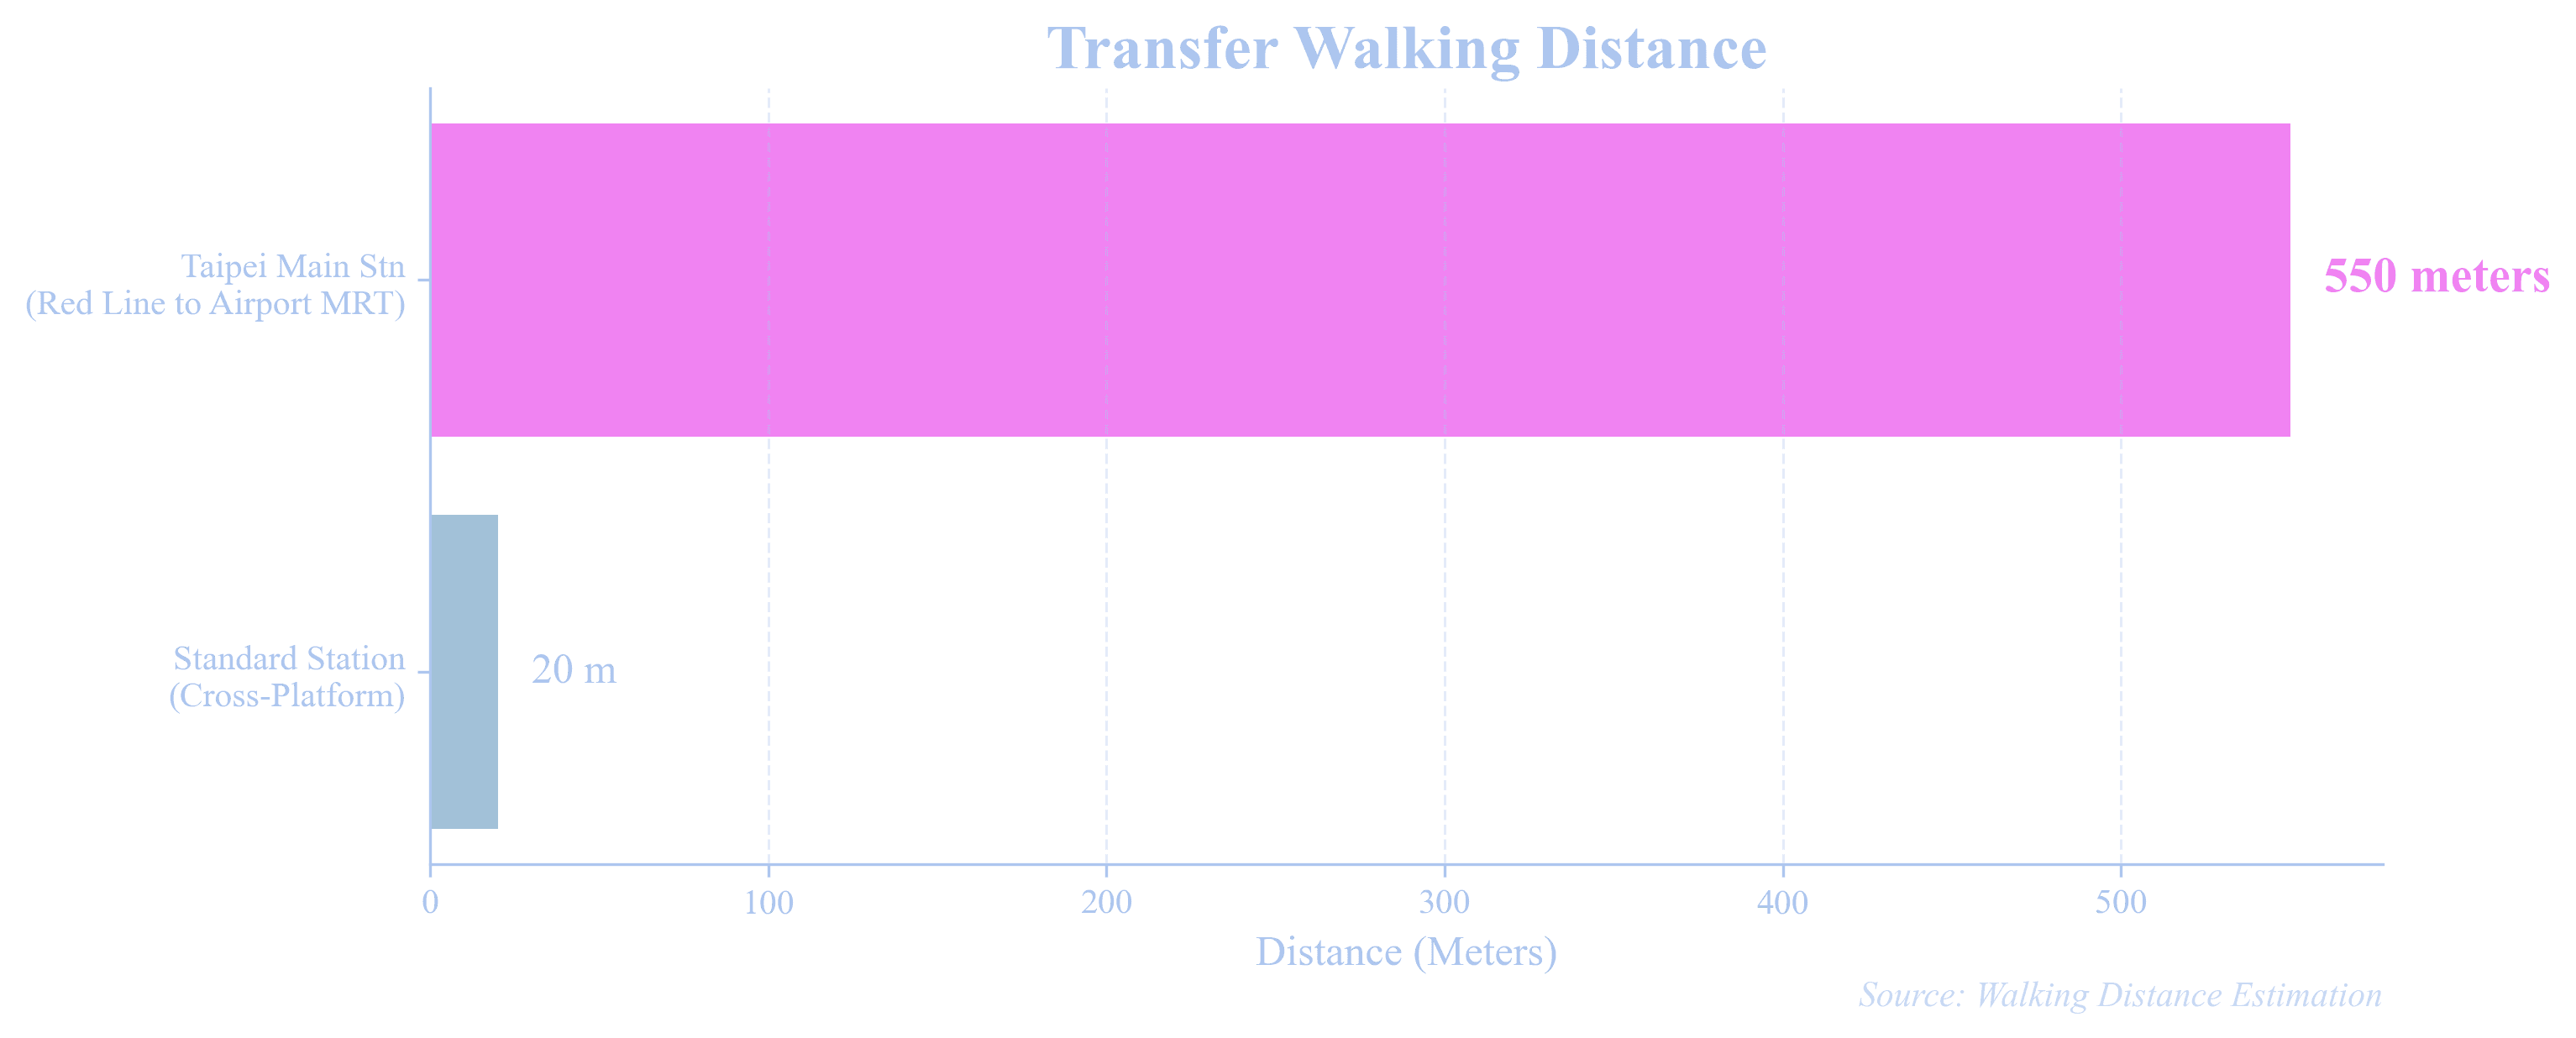
A single transfer can exceed 550 meters, nearly 30× longer than a standard cross-platform transfer.
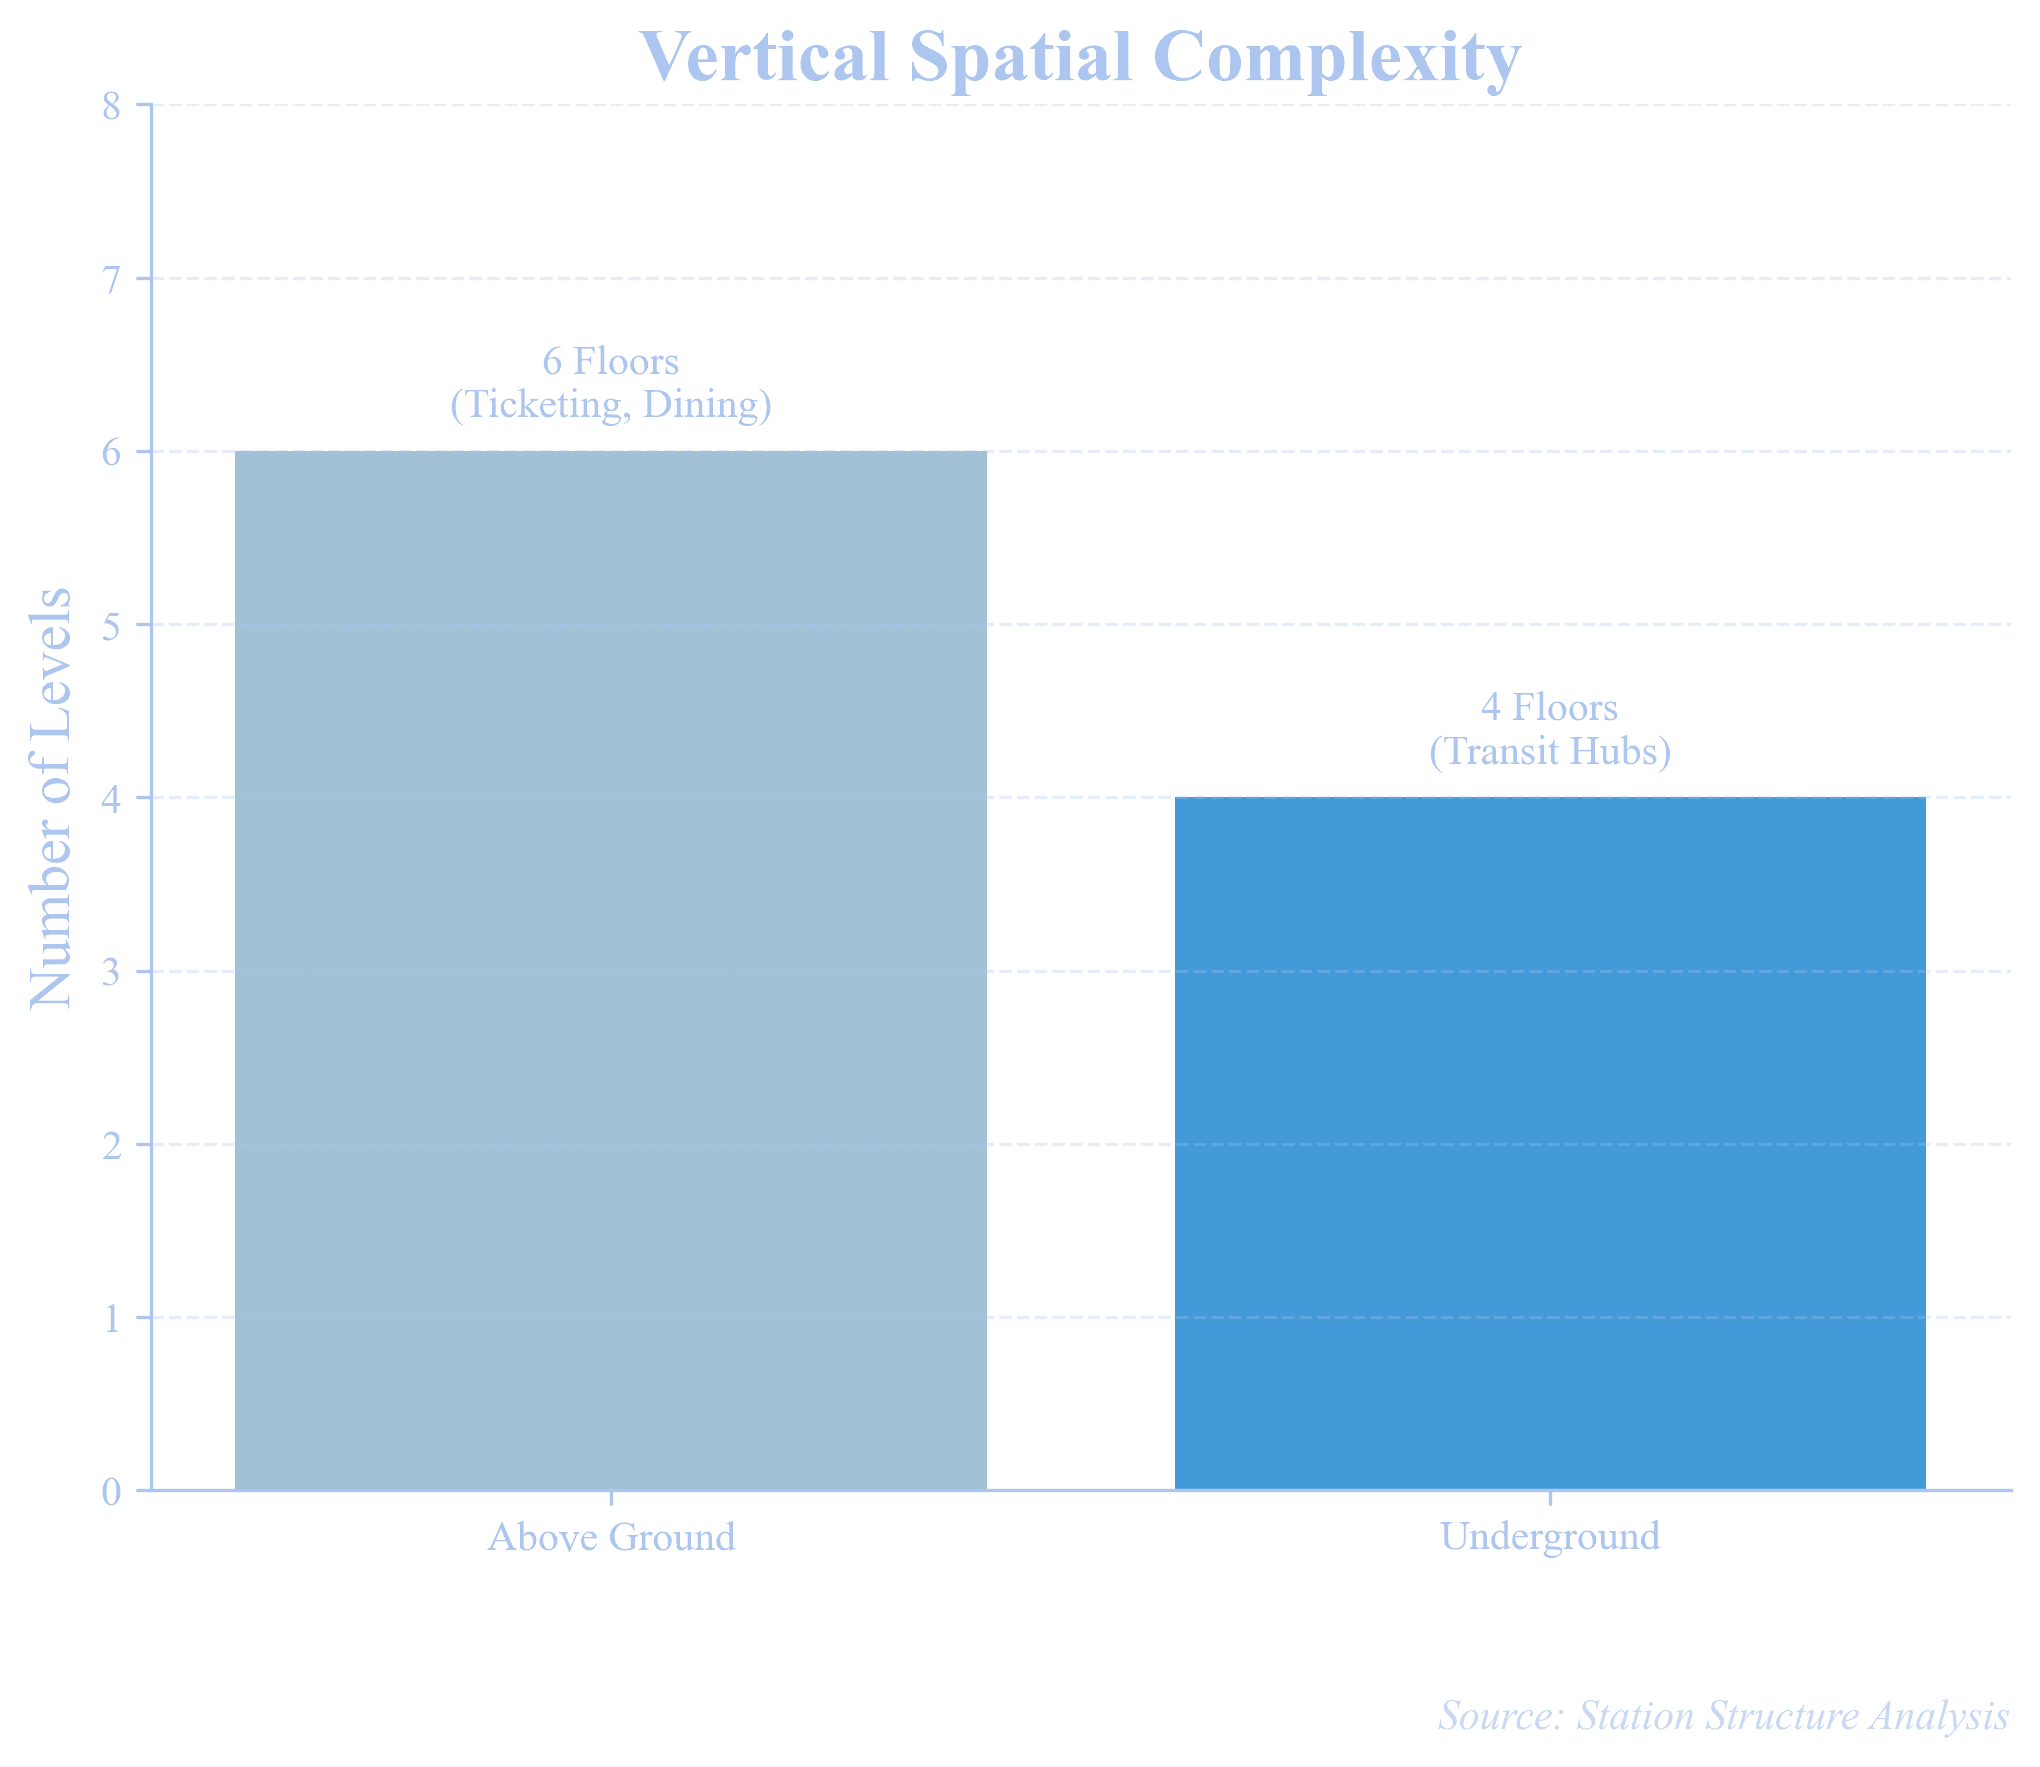
Vertically, Taipei Main Station is tall, but everyday flows are squeezed into just a few layers (2F–B2), turning escalators and lifts into critical bottlenecks.
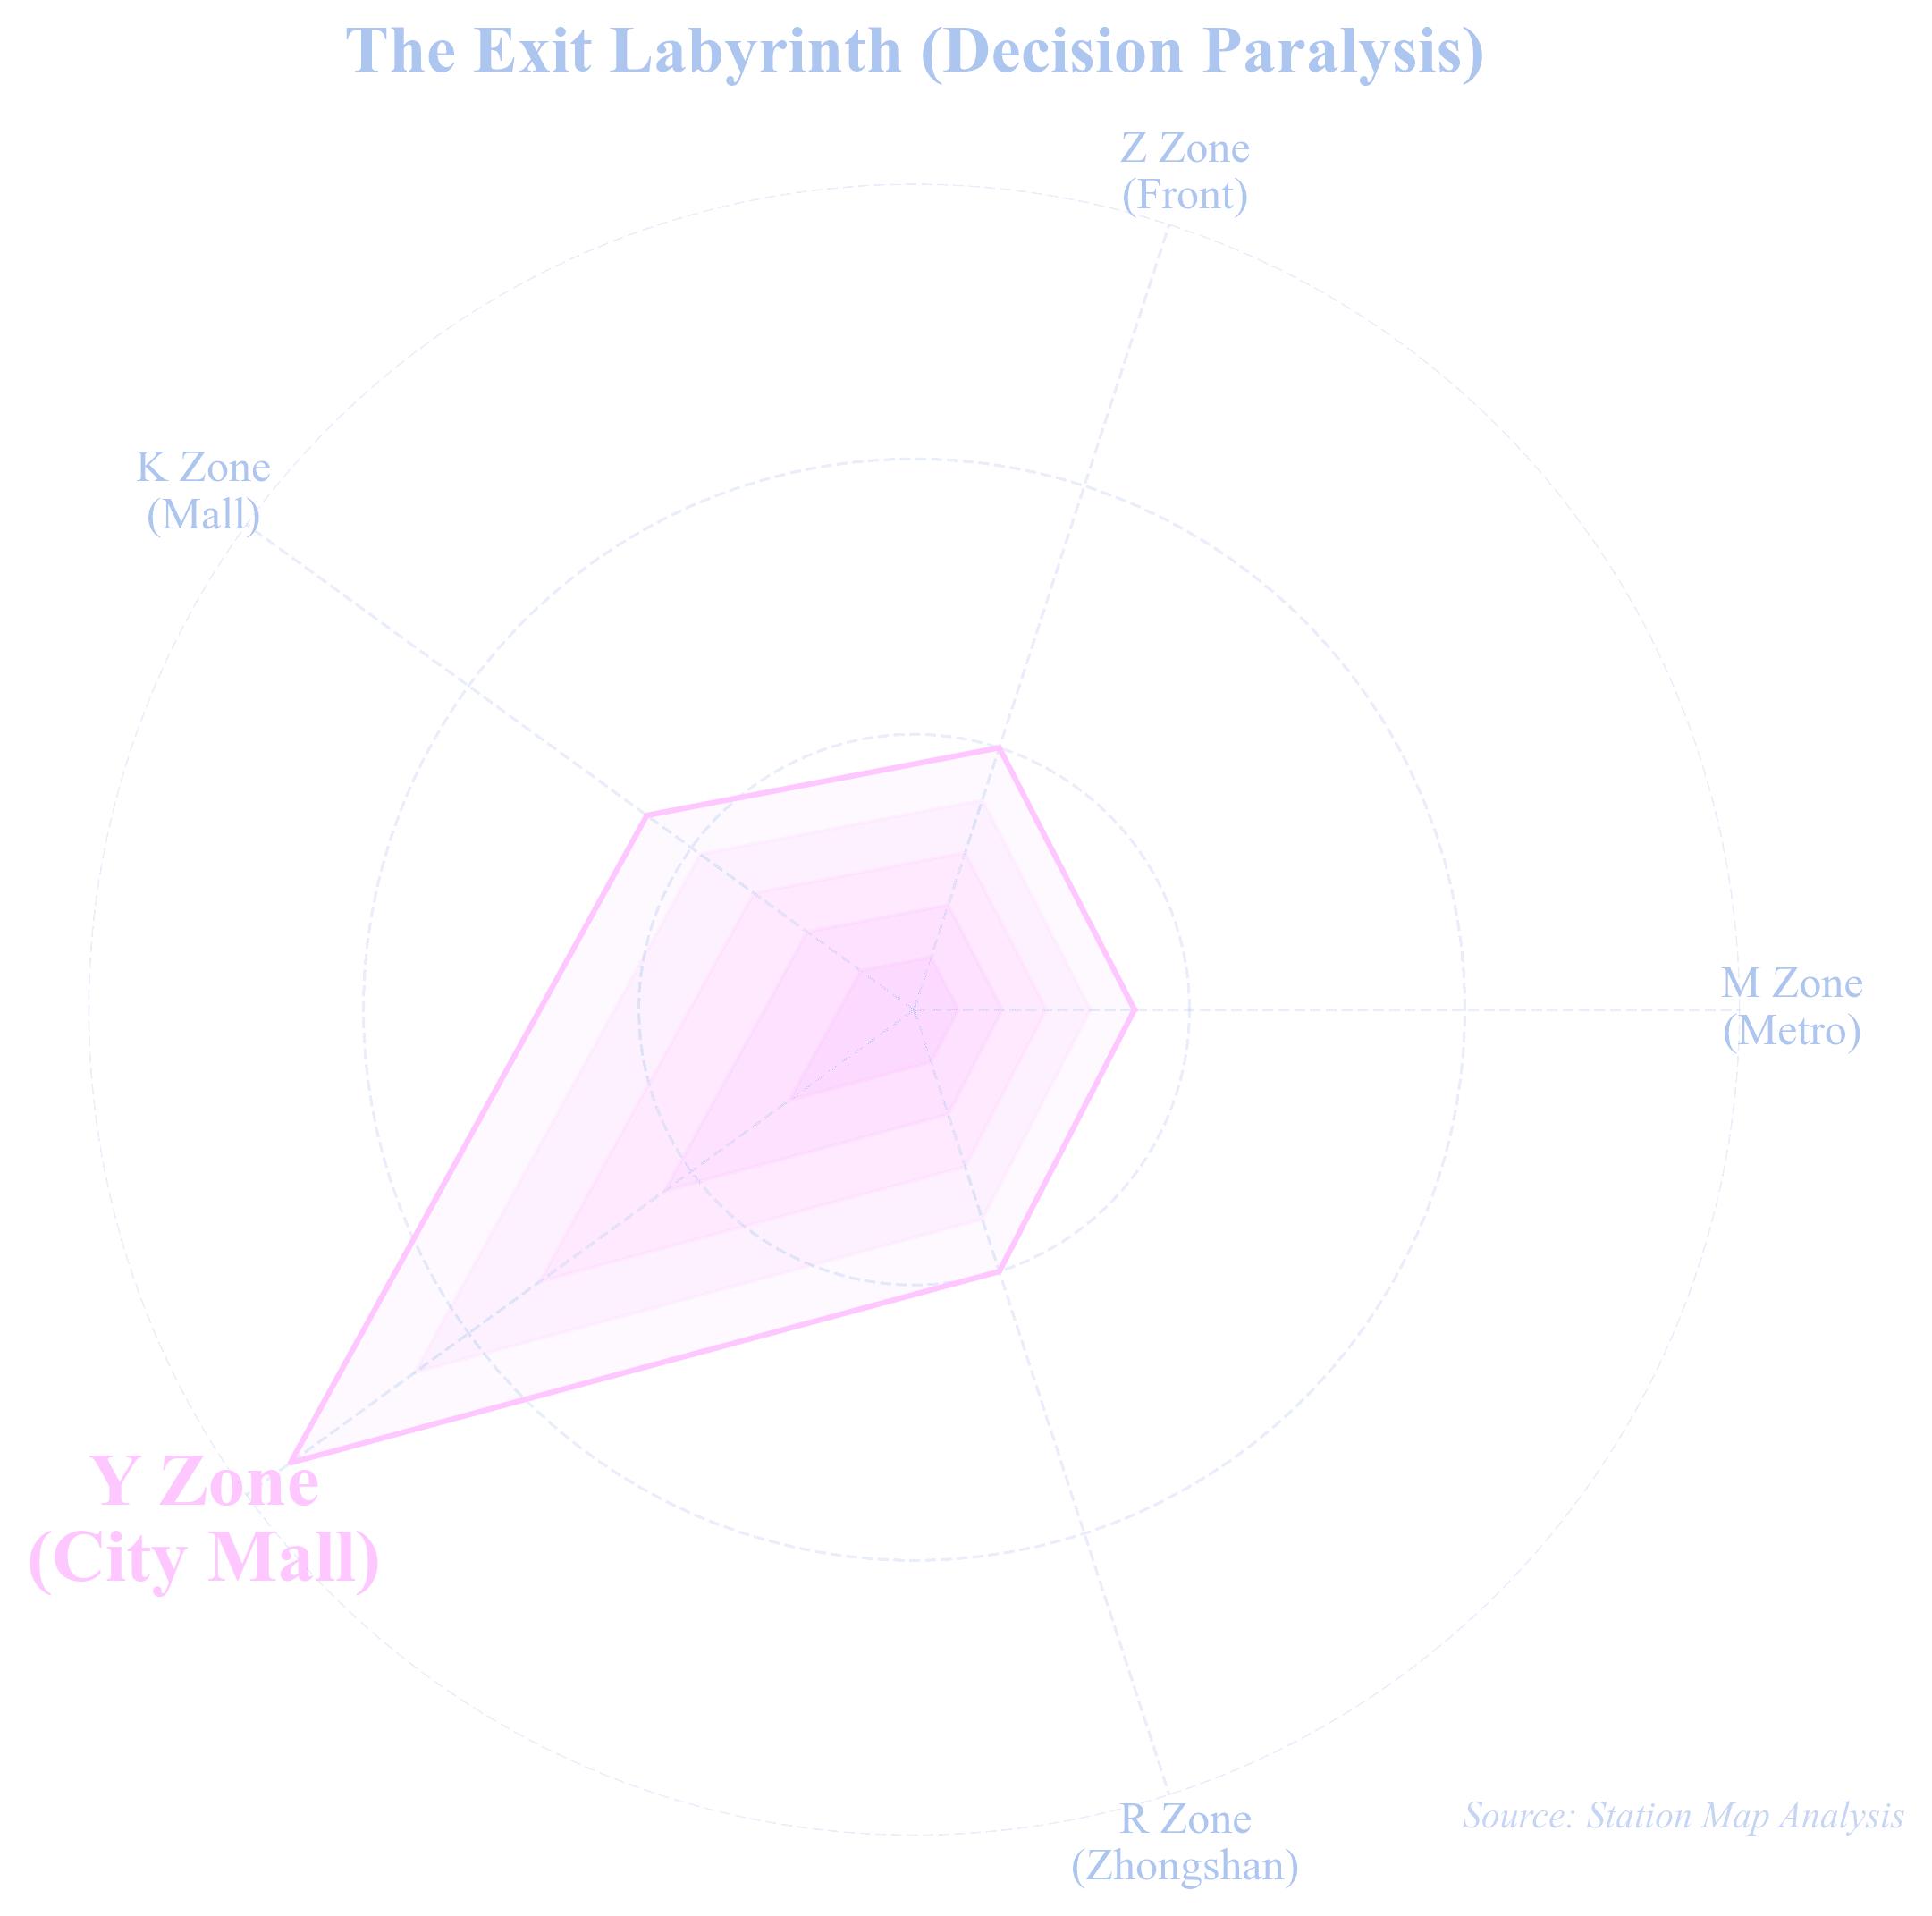
The Y Zone (City Mall) has the highest decision load because up to 28 exits and an entire underground mall branch off from a single straight corridor.
1-2
Spatial Configuration(DepthmapX)
Base Geometry of Taipei Main Station:
The station consists of long linear corridors (north–south spine) and multiple branching pockets. This underlying geometry strongly influences movement and visibility.

The Y Zone (City Mall) has the highest decision load because up to 28 exits and an entire underground mall branch off from a single straight corridor.
Connectivity (VGA) Local Visibility:
Each cell's connectivity – how many neighboring cells it can directly see/reach. Brighter areas indicate more immediate connections, while darker areas indicate local isolation.
It highlights the main transfer spine and vertical cores (escalators/stairs cluster) as locally “thick” spaces, while side corridors and dead-end branches show up as thin, fragmented links.

The Y Zone (City Mall) has the highest decision load because up to 28 exits and an entire underground mall branch off from a single straight corridor.
Gate Map:
Shows where pedestrian movement actually concentrates within the network. Brighter corridors are crossed by many more paths; darker ones remain relatively quiet. The map highlights how flows are pulled into the east–west spine between Y Zone and the TRA–THSR concourse, while peripheral branches and dead-end corridors receive far less use.

The Y Zone (City Mall) carries the heaviest through-flow: most passengers pass along this corridor when transferring between the Airport MRT, TRA/THSR concourse, and the red/blue metro lines, while vertical flows converge at the M/Z transfer core.
Integration Map:
Global Integration highlights the main east–west passenger spine and the central TRA–THSR concourse as the most globally accessible spaces. The Z/K/M vertical transfer cores (major escalator–stair clusters) also emerge as integration hotspots due to their critical role in linking upper and lower mall levels.

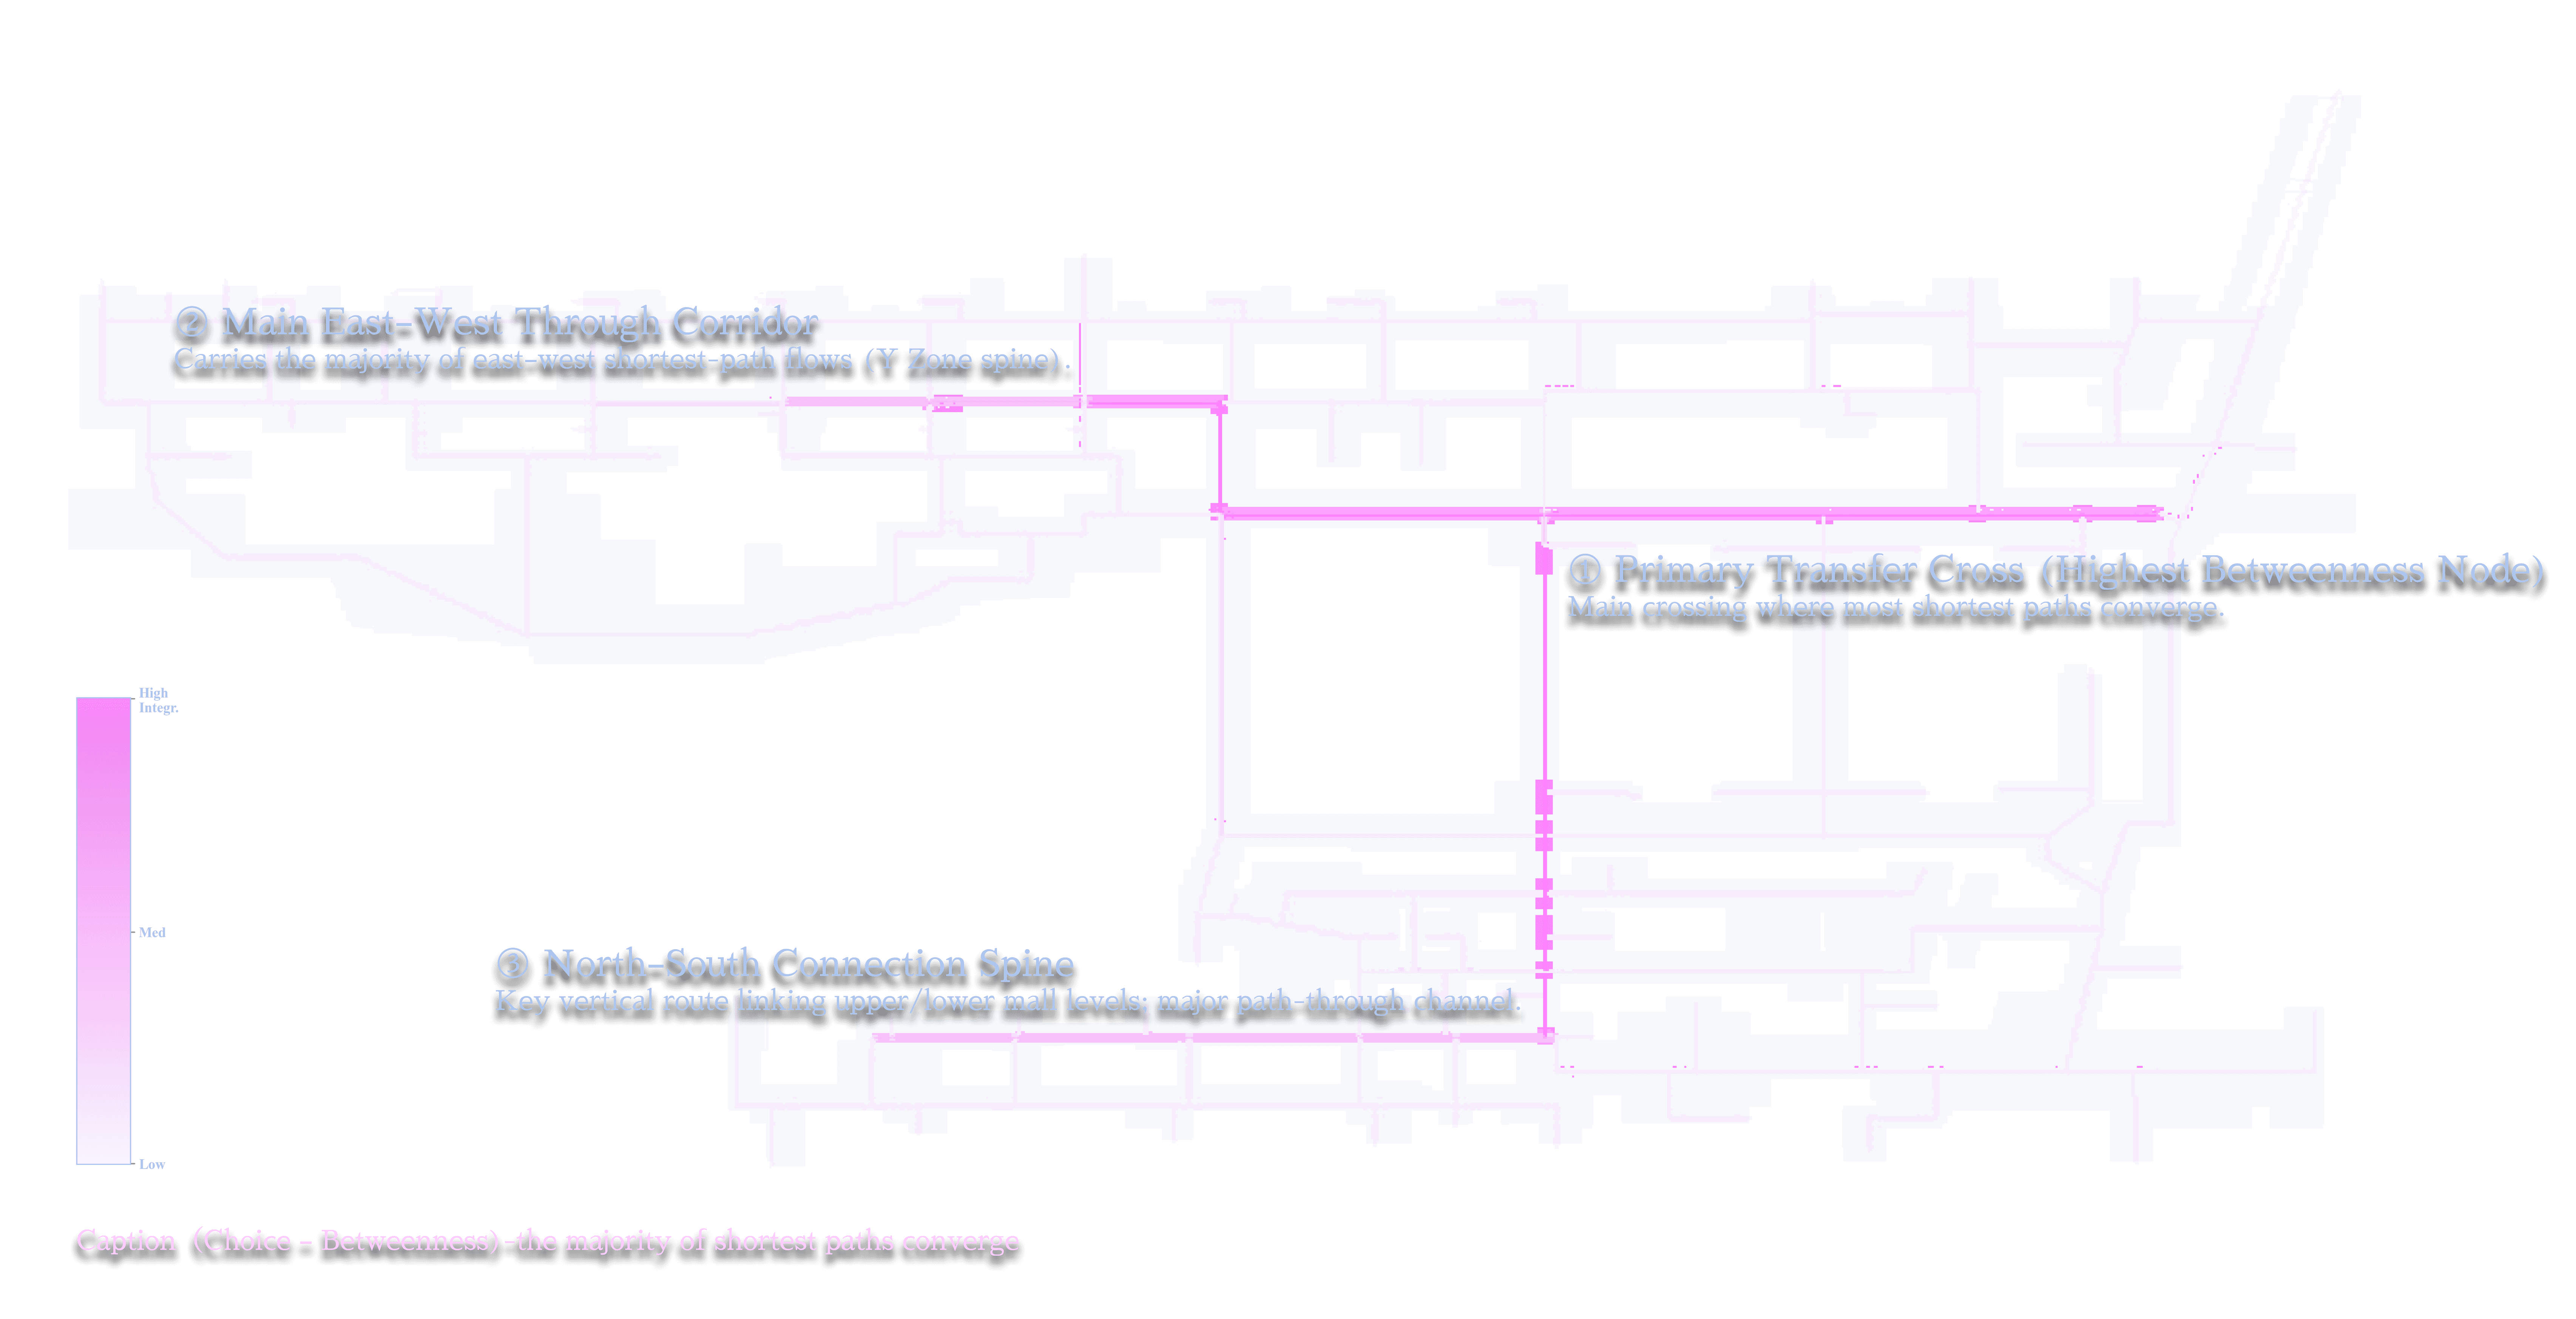
Choice-Betweenness:
Betweenness highlights where the majority of shortest paths converge. The central transfer cross shows the highest concentration of path-through flows, forming the network’s primary routing hinge. The Y-zone east–west corridor functions as the main through-route, while the north–south vertical spine forms the key shortcut connecting the upper and lower mall levels.
Generative Maze & Spatial Translation
Building on the axial and gate analyses of Taipei Main Station, I first translated the circulation patterns into a square grid that could be procedurally rewritten. Each point in this grid acts as a potential node, while a recursive Grasshopper–Anemone loop selectively activates them to carve a single continuous route. By tuning step length, turning probability, and stopping rules, the same system can generate mazes that range from tight, disorienting paths to clearer, more directional corridors.
This abstract maze skeleton then becomes the base for the spatial and material modules developed in the following sections.
Recursive Grasshopper system that iteratively activates grid cells to grow a continuous maze path, turning a neutral point field into a navigable spatial skeleton.
A recursive Grasshopper system that computes path networks and converts them into modular wall assemblies.
2-1
Generative Maze Logic(Grasshopper Anemone)
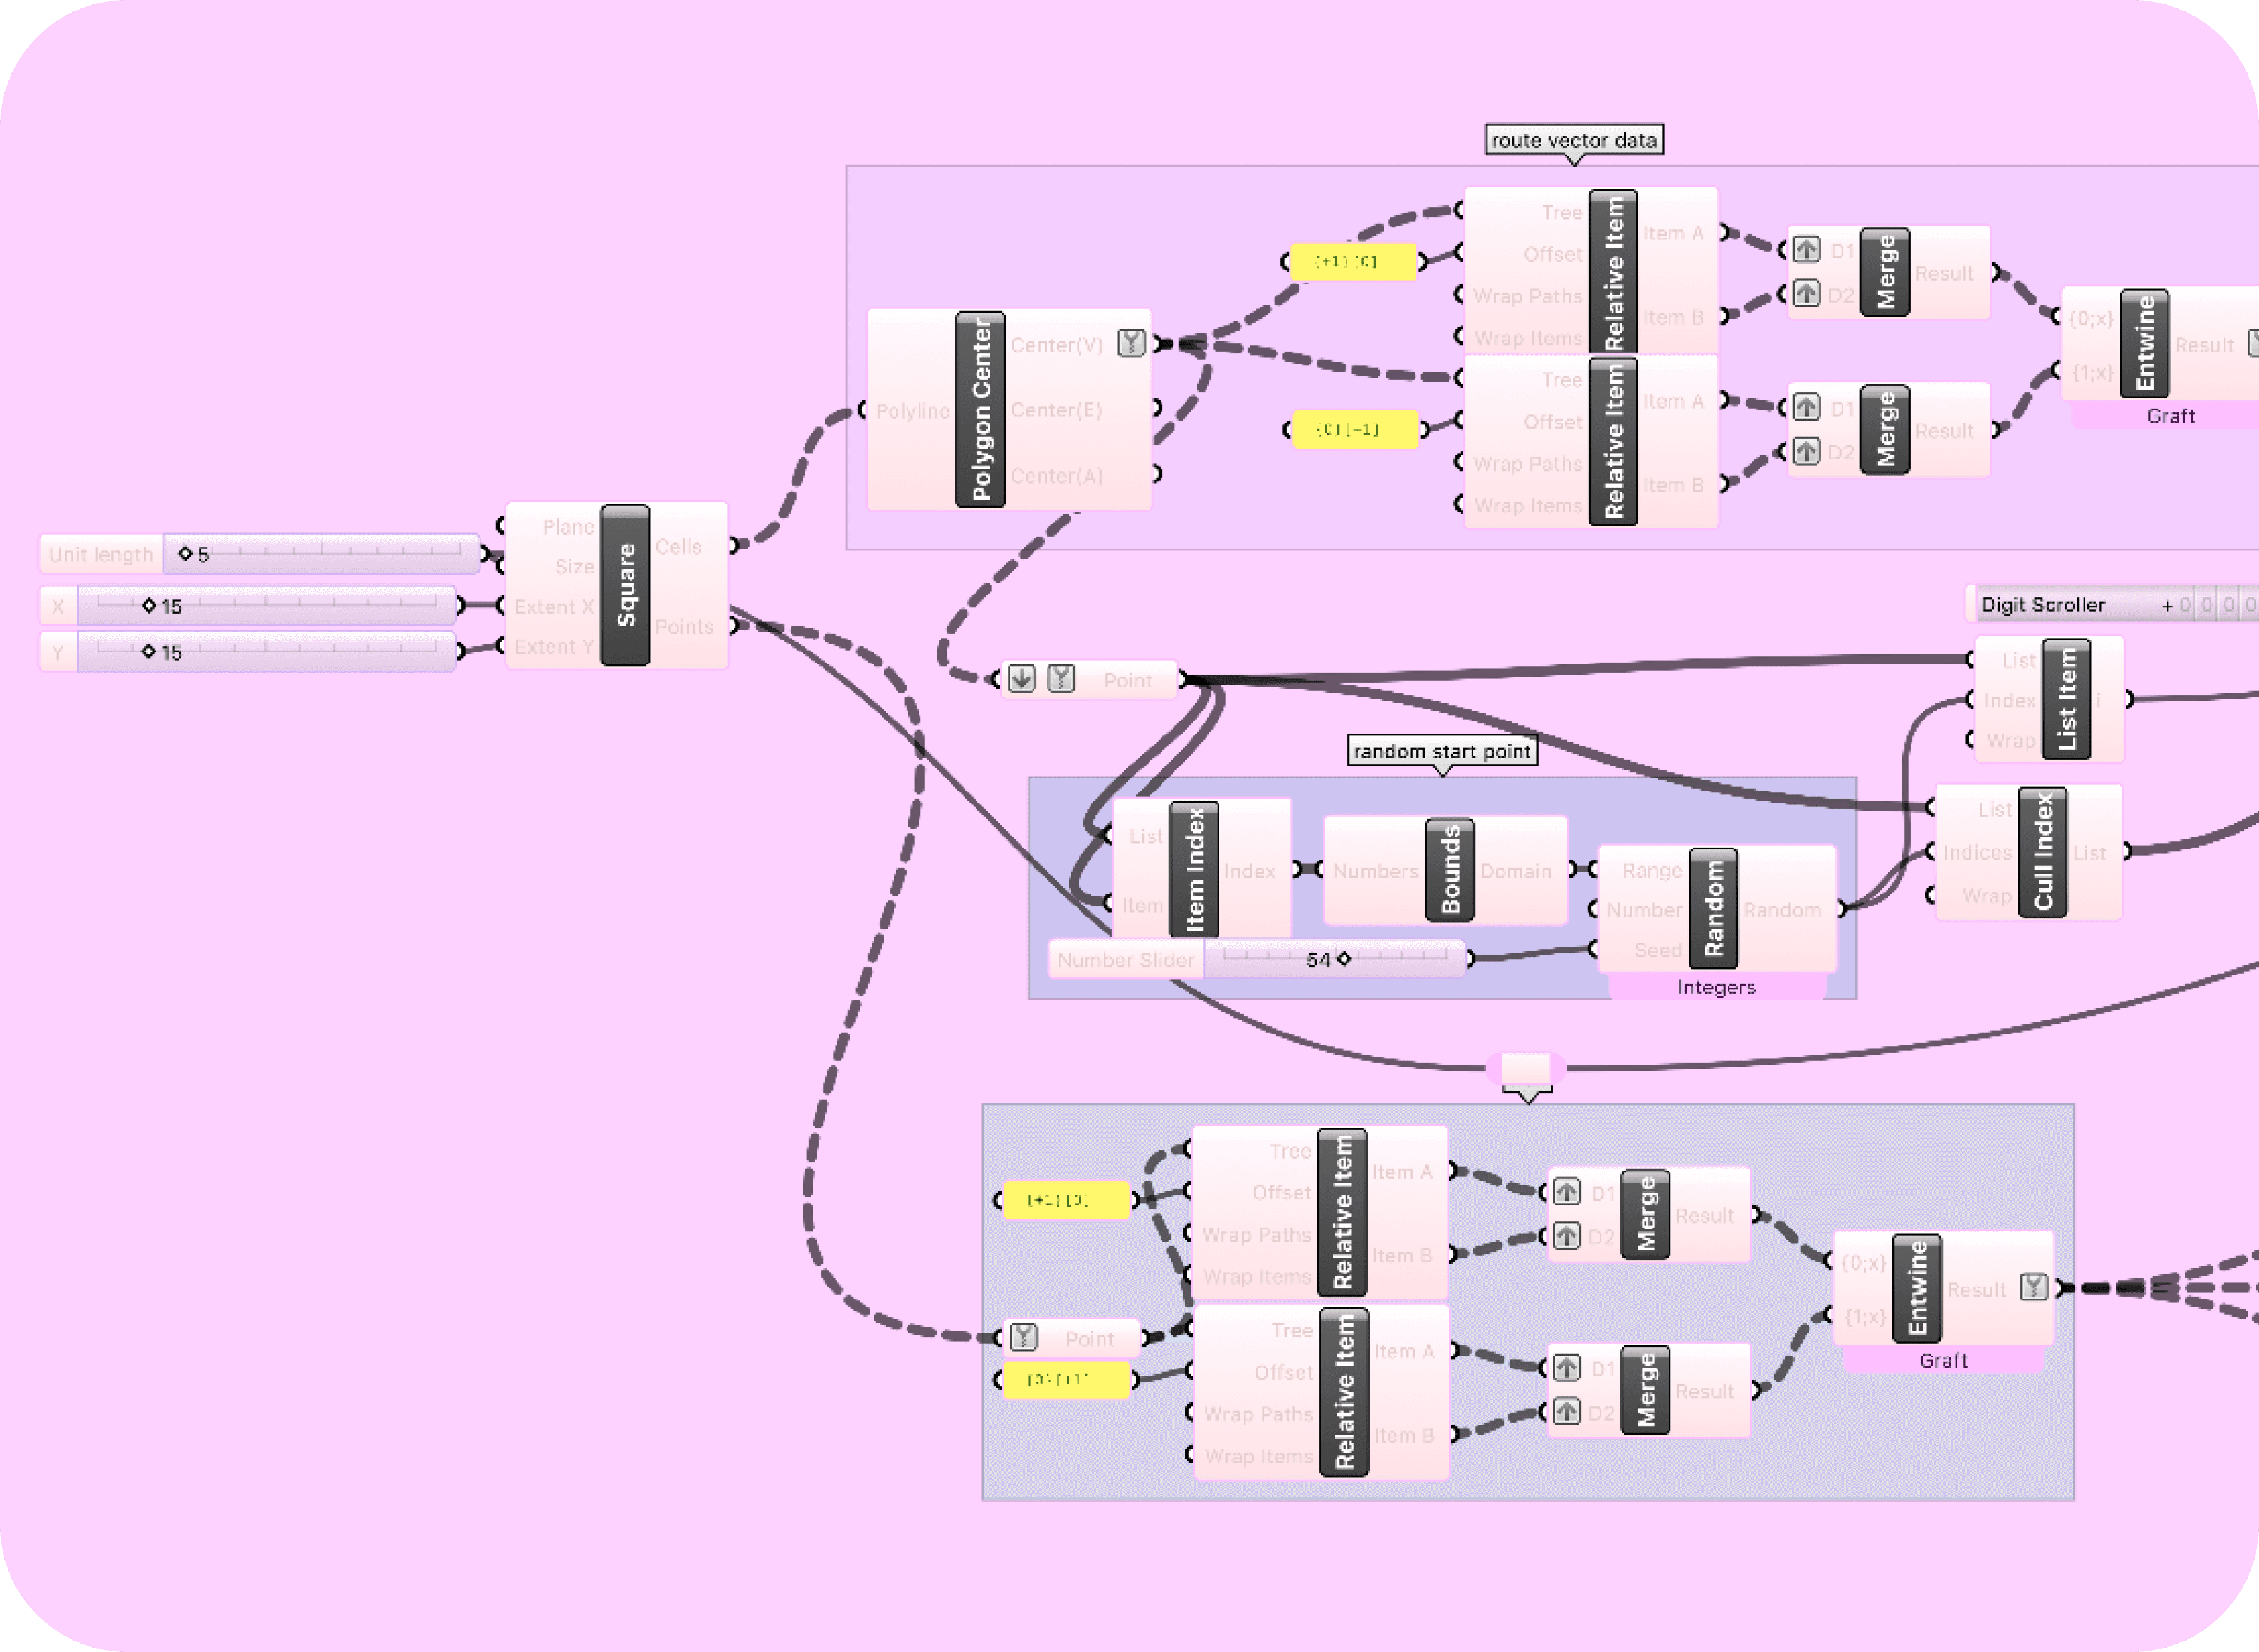
① Grid & Seed Initialization Caption
Generates the base grid and selects the initial seed for maze growth.
Defines unit size, grid resolution, and starting point that anchor the entire generative process.
② Iterative Path Growth (Anemone Loop)
Expands the maze step-by-step using recursive movement rules.
Each iteration tests directional validity, avoids collisions, and appends the next valid cell to the path.
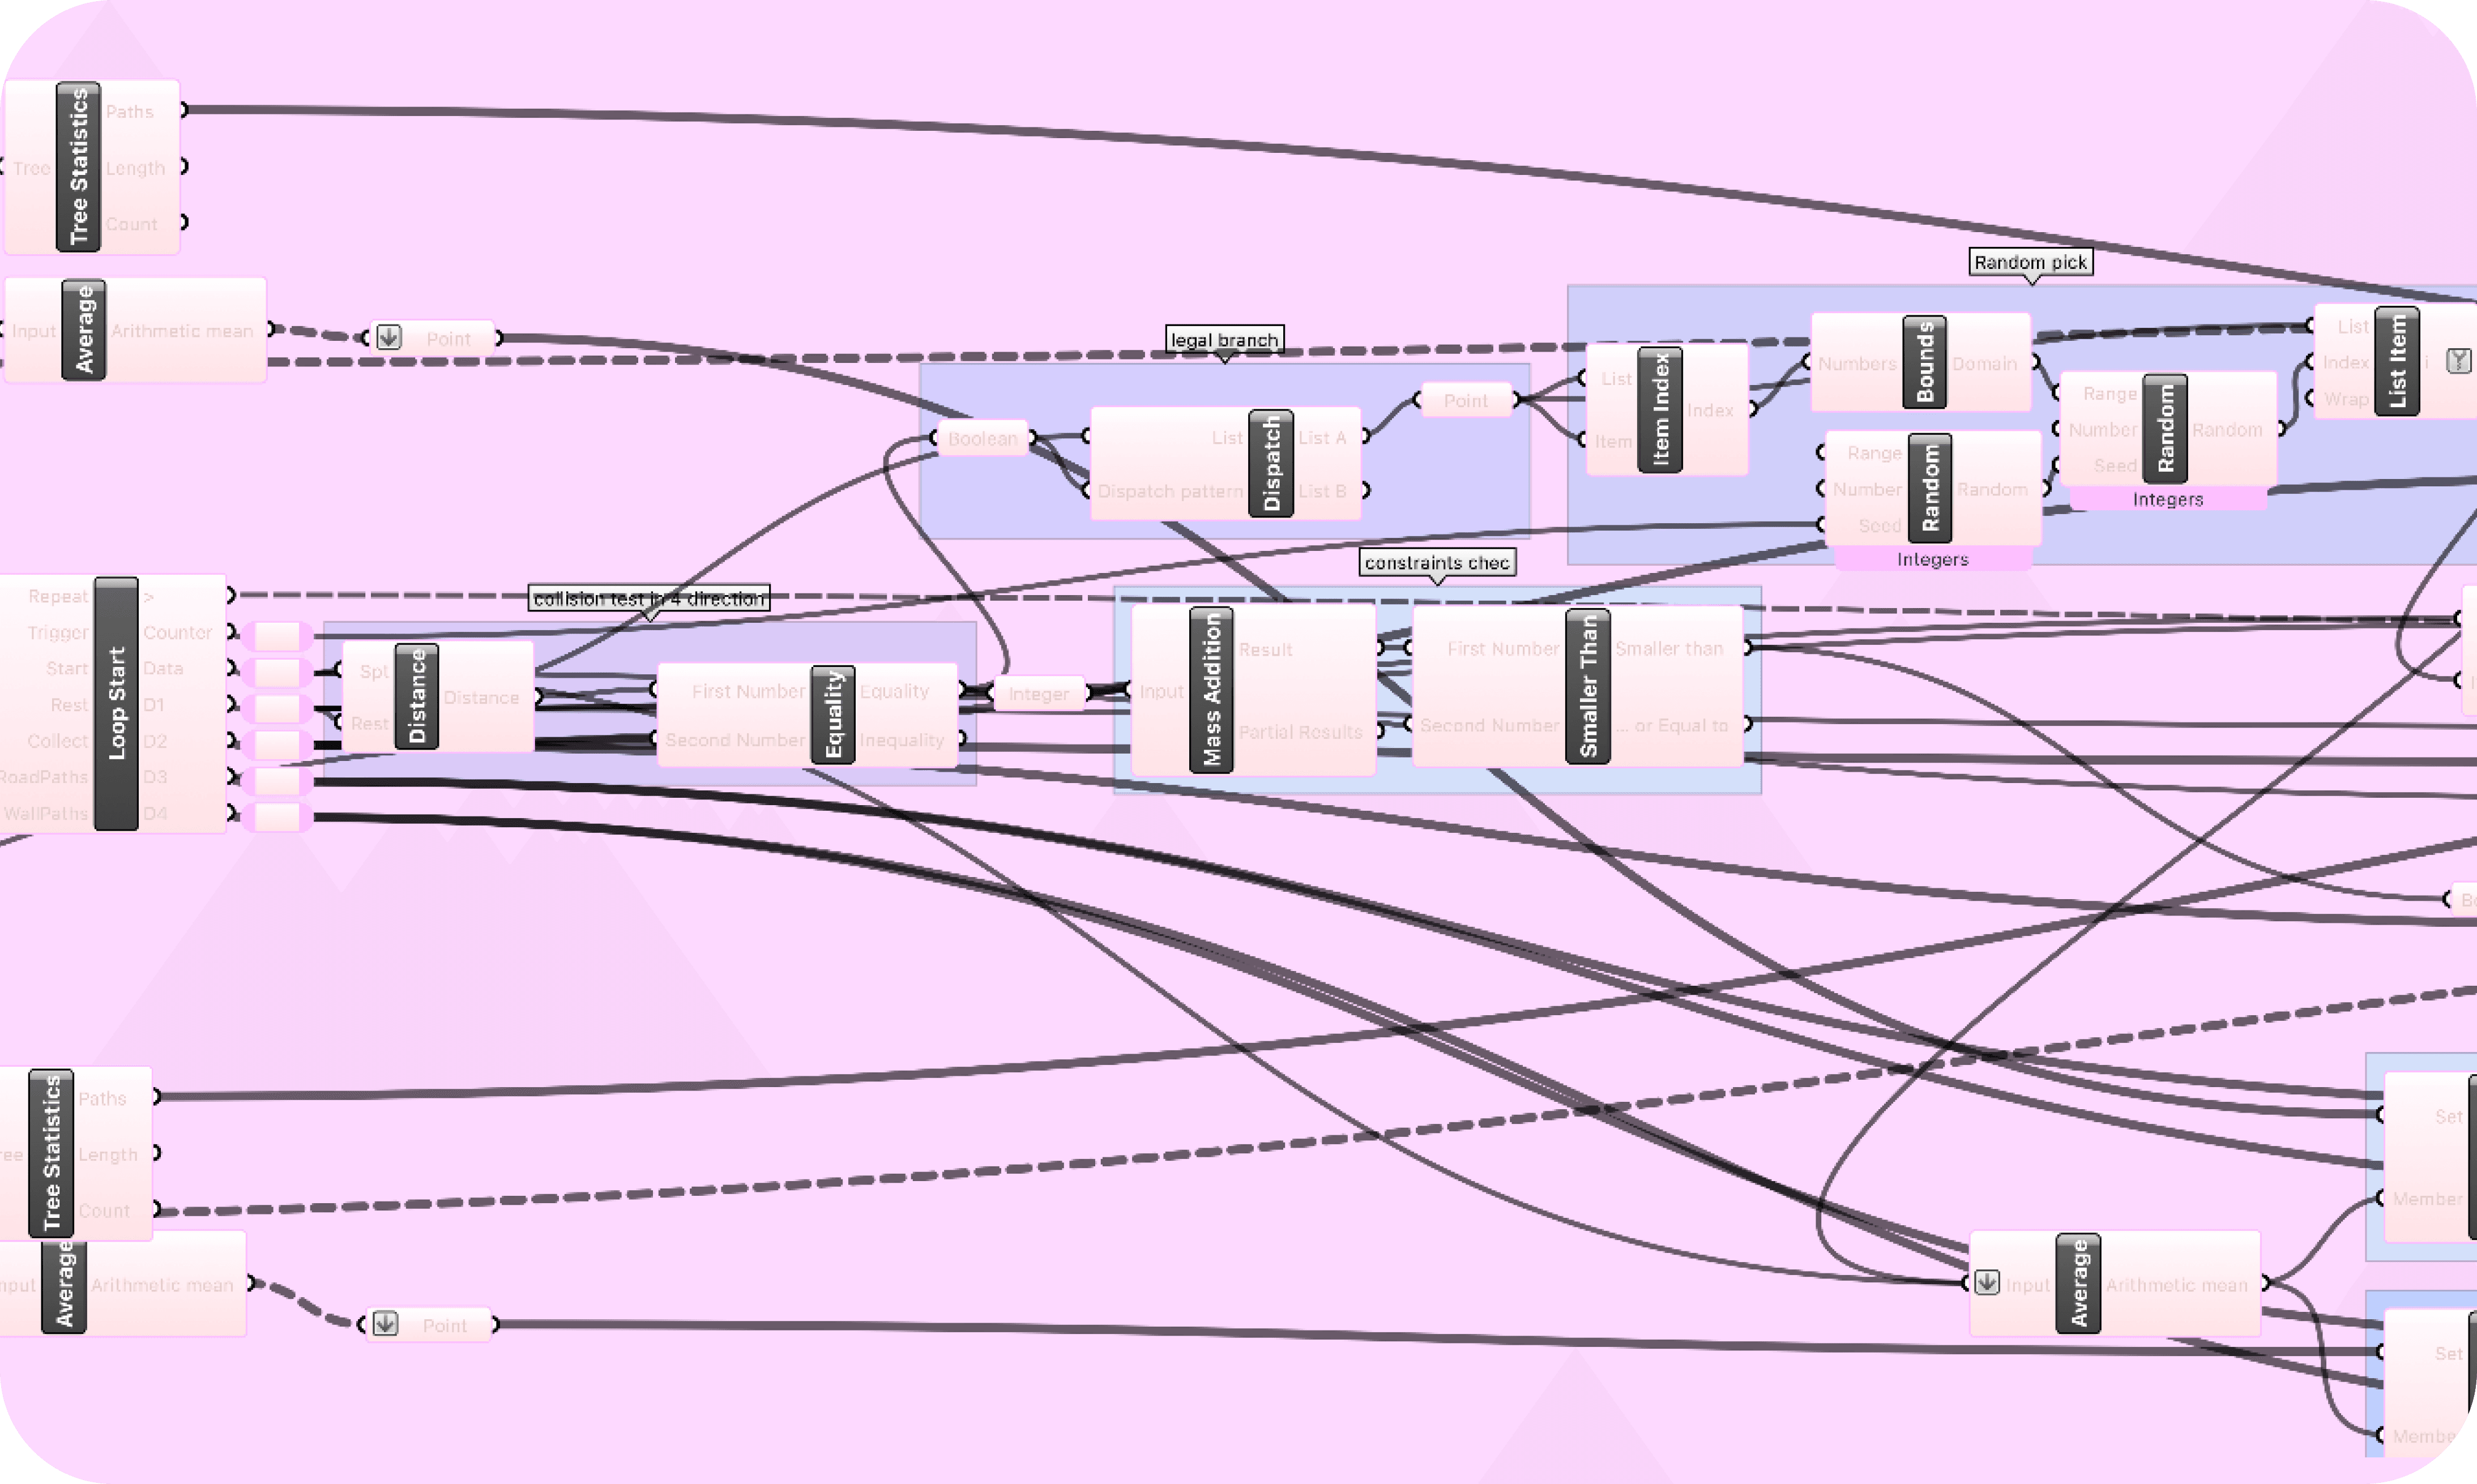

③ Branching & Backtracking Logic
Manages branch candidates and fallback nodes to build a non-linear maze network.
A dynamic candidate list enables branching, while backtracking ensures no dead-end traps break the maze continuity.
④ Geometry Assembly (3D Maze Construction)
Converts abstract route data into wall geometry through polyline, offset, and extrusion.
Each path becomes a wall module with varied thickness and material presets, forming the final spatial structure.

2-2
Space Design and Spatial Typologies
Starting from the generated maze skeleton, different spatial and material logics were introduced to transform the abstract path network into walkable architectural sequences. These wall modules—varying in transparency, texture, thickness, and opening logic—were assembled to influence movement speed, visibility, and pacing. The final maze alternates between compressed, textured segments for slow pacing and open, bright passages for fast transit, following behavioral patterns observed in Taipei Main Station.

① From Abstract Maze to Spatial Intent
The generated maze provides a neutral spatial skeleton. Before assigning materials or spatial typologies, the geometry functions like an abstract circulation model—an unbiased grid of possible routes and pauses.
② Behavioral Speed Hierarchy
Different user types—from slow drifters to fast commuters—are mapped along a speed axis that becomes the backbone for later spatial decisions.

③ Spatial Typologies along the Speed Axis
Five pairs of spatial cues (vertical/horizontal, stairs/ramp, small/big, narrow/wide, dark/bright) translate movement speed into distinct spatial experiences.


④ Spatial Modules (Units of Experience)
These cues are condensed into repeatable spatial modules that combine enclosure, width, brightness and height difference into walkable units.
⑤ Route Assembly from Spatial Modules
Modules are distributed along the maze paths, alternating slow, compressed segments with open, legible corridors to choreograph pacing and orientation.
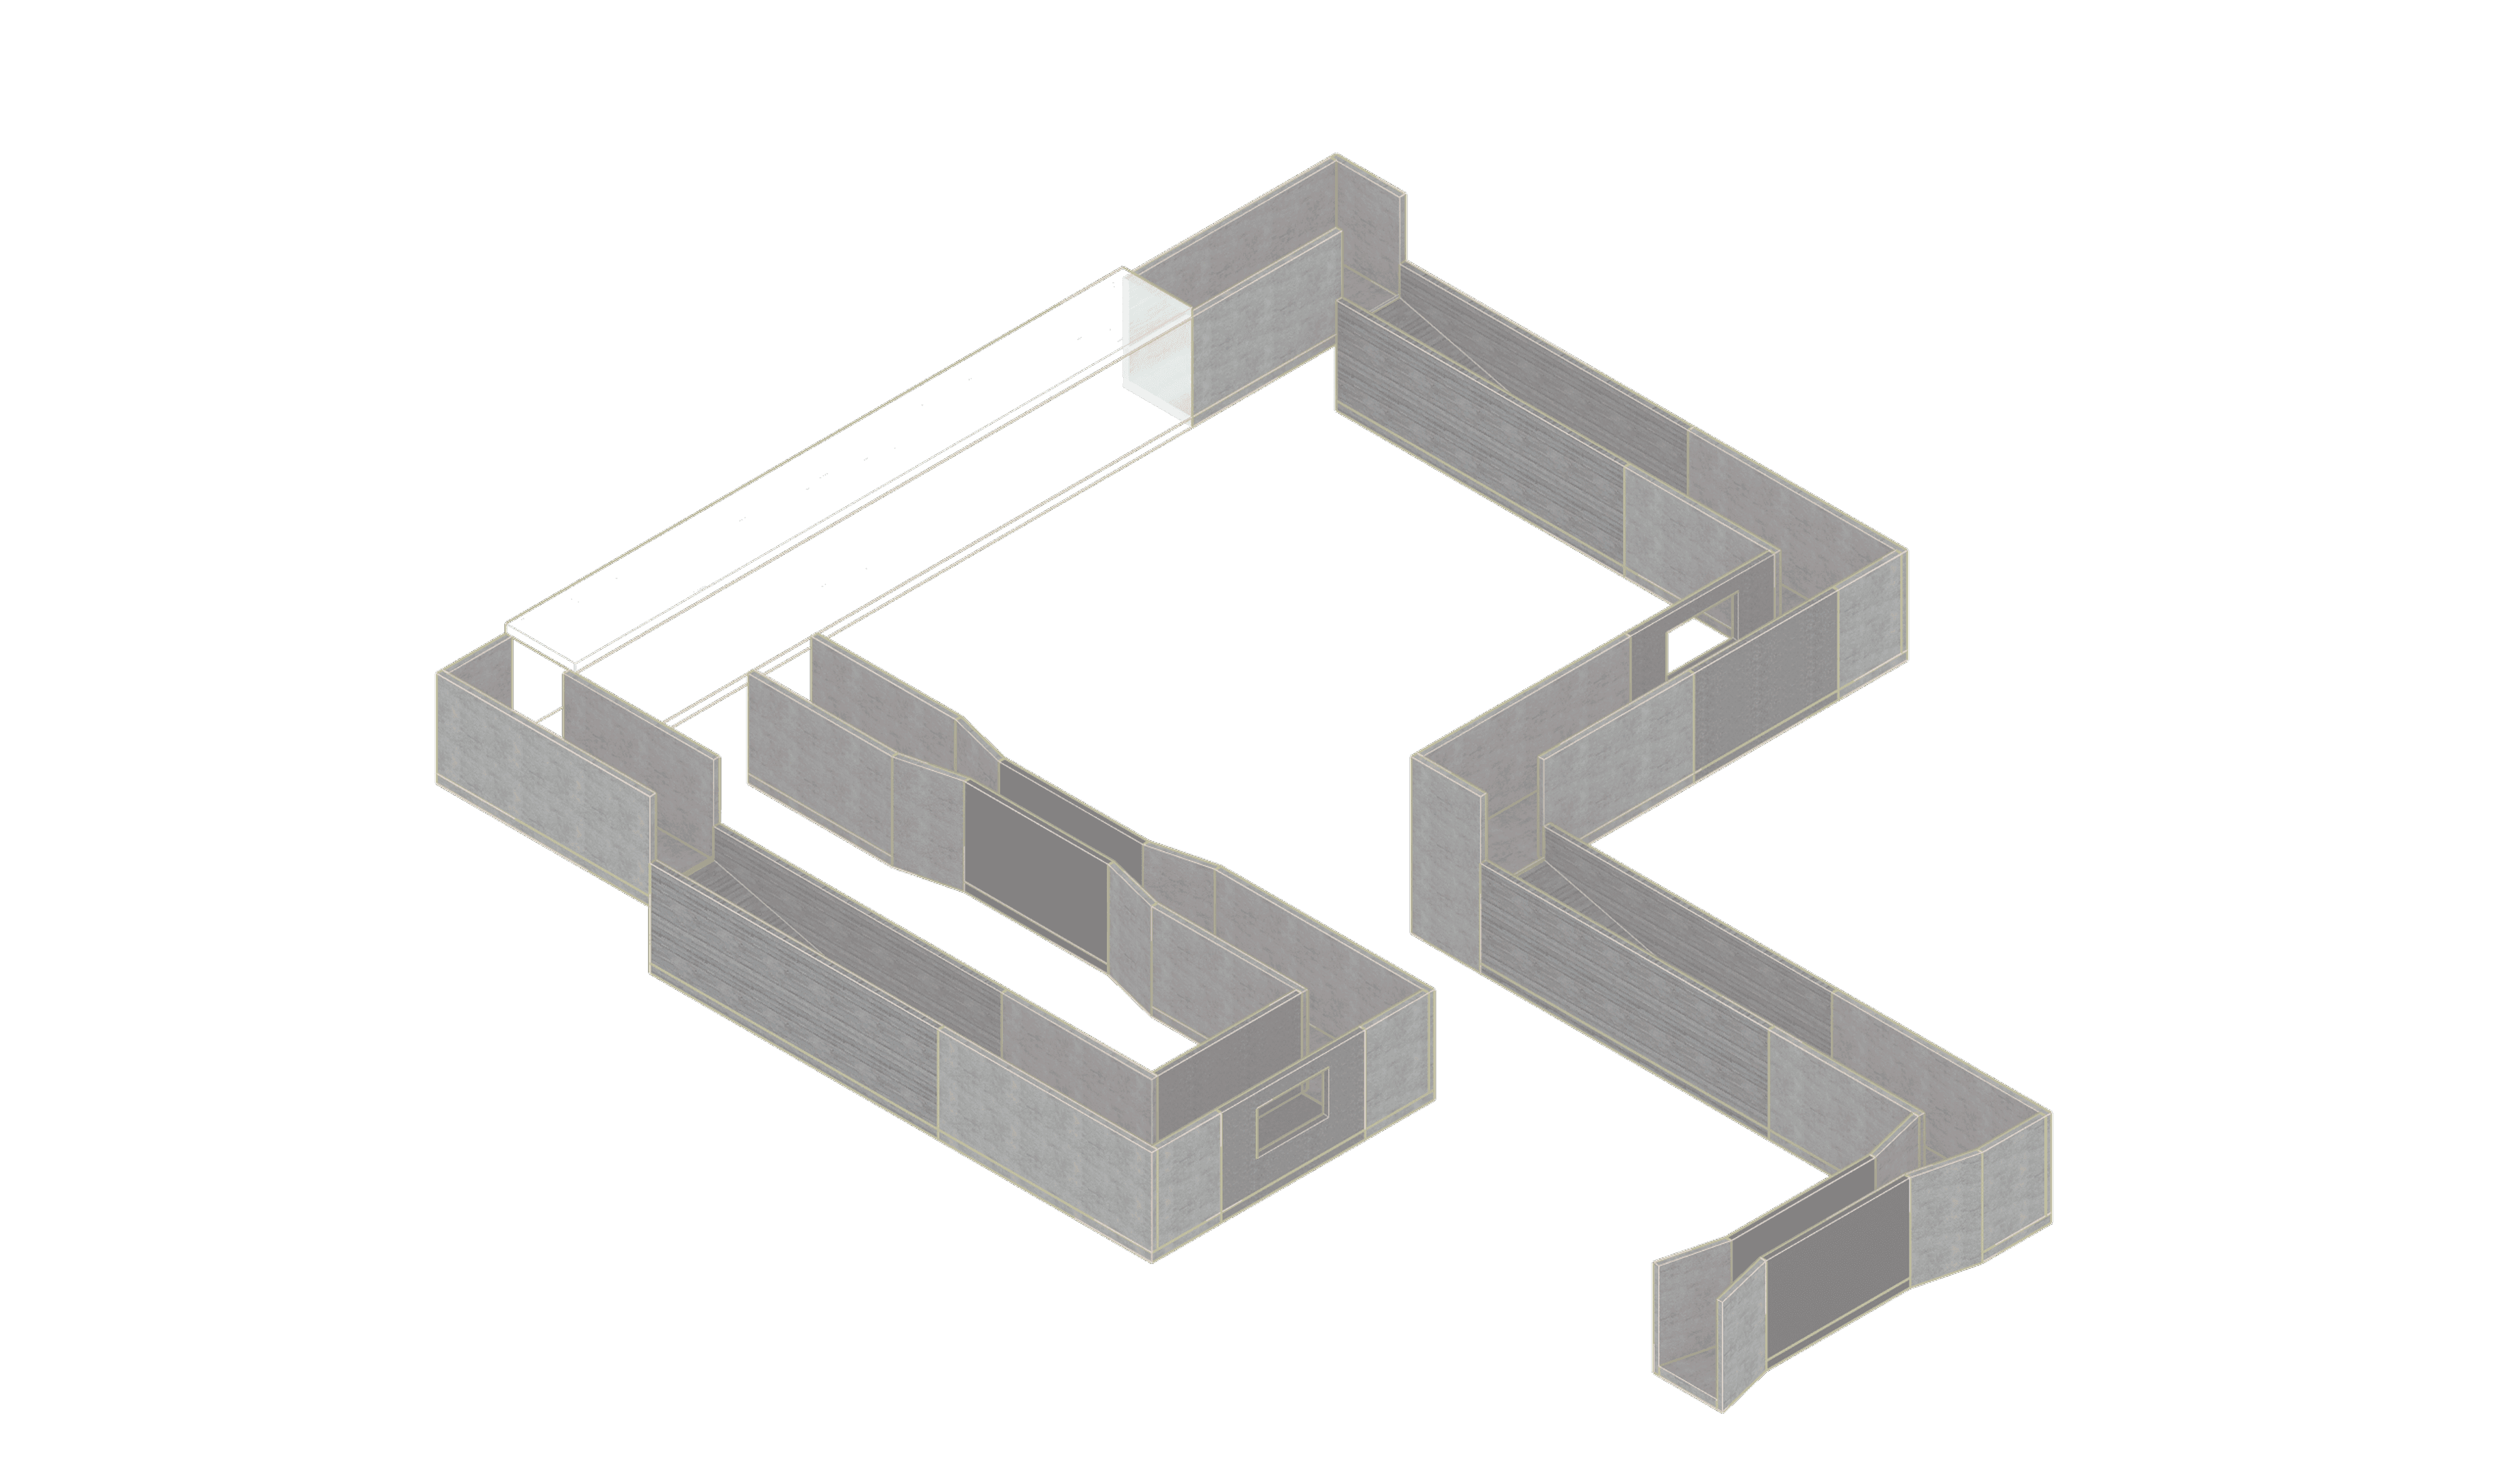

⑥ Asymmetric Layout Transformation
The initially symmetric maze is reshaped into an asymmetric figure to echo Taipei Main Station’s unbalanced circulation and offset transfer cores.
⑦ Three Directional Branches Embedded
The final layout splits into three main branches, abstracting flows toward the Airport MRT,
MRT / city exits, and the TRA–THSR–Y-zone corridor.
3. Crowd-Aware Maze System
This chapter turns the station’s movement analysis into a crowd-aware maze. Layout validation, spatial typologies, behavior rules, and a Unity implementation are introduced in sequence, so that by the end of the chapter the maze is not just drawable on paper but populated by agents whose movement reflects Taipei Main Station’s three dominant flows, ready to be experienced later in VR.
3-1
Spatial Implementation:From Generated Paths to Walkable Space
Challenge: Connecting the custom joints to the main structural frame was geometrically complex due to the skewed axes of the geodesic lines. A simple distance check caused errors where lines would connect to the "wrong neighbor."
Layout Validation
① Global Integration Fields (DepthmapX)
Identifying Dominant Movement Vectors Global Integration fields (Integration[HH]) reveal three dominant movement vectors inside Taipei Main Station:
Main Transfer Hub: the highest global integration zone located at the TRA–THSR concourse.
East–West Global Integration Spine: the long Y-zone corridor linking MRT, city exits, and commercial zones.
Vertical Integration Core: the major escalator/stair cluster connecting multiple floor plates.

These fields represent the station’s intrinsic directional pressures—how people naturally converge, disperse, and shift levels.
② Translating Movement Pressures Into Spatial Rules
The three integration peaks are converted into design rules used in the maze:
Compressed transitional nodes → represent intermodal hubs
Long, legible corridors → represent high-integration spines
Height-shift sequences → represent the vertical core's circulation logic

Each integration peak corresponds to a characteristic spatial condition in the maze: a long spine corridor, a compressed transfer hub, and a vertical core of slopes and stairs.
③ Unity Prototype Validation — Embedding the Same Three Directions
The same three vectors are embedded into the final playable space in Unity.
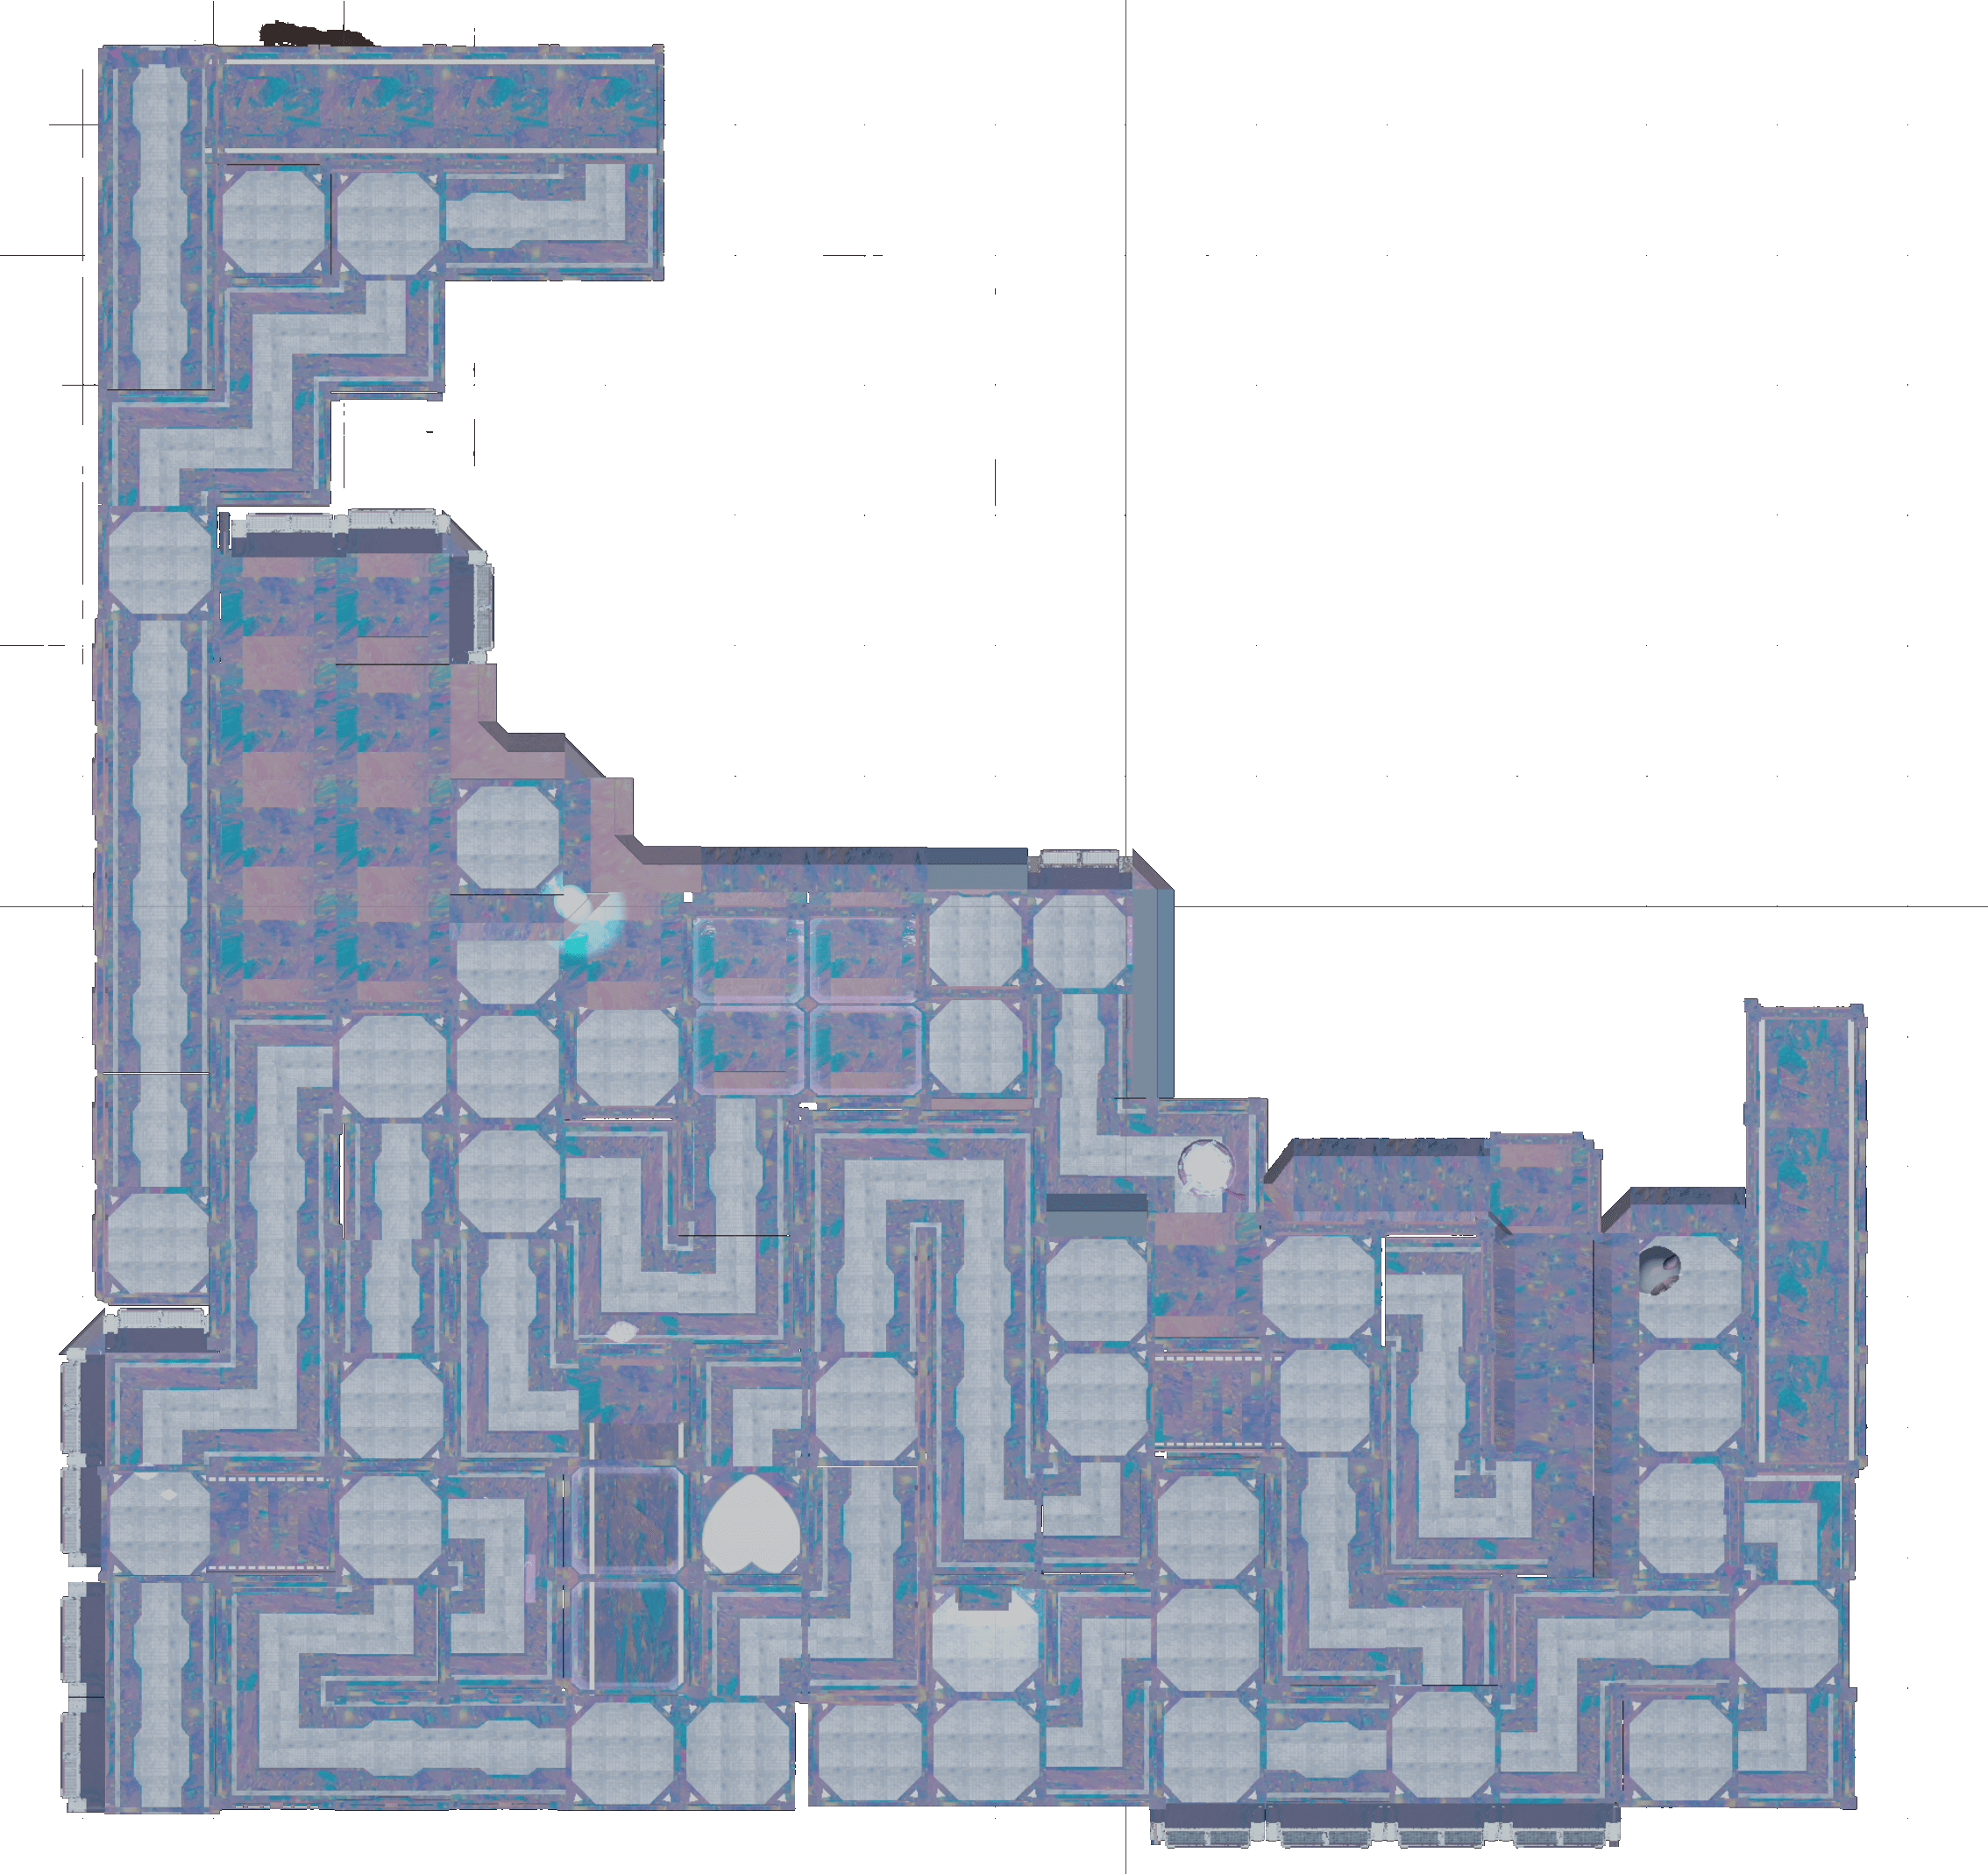
Walkable regions generated by NavMesh
Directional flow tendencies emerging from the layout
The three-branch divergence inherited from Taipei Main Station

1F NavMesh showing continuous walkable fields that favor the three dominant directions.
2F NavMesh extending the same directional bias into the upper level circulation.
3-2
Spatial Typologies
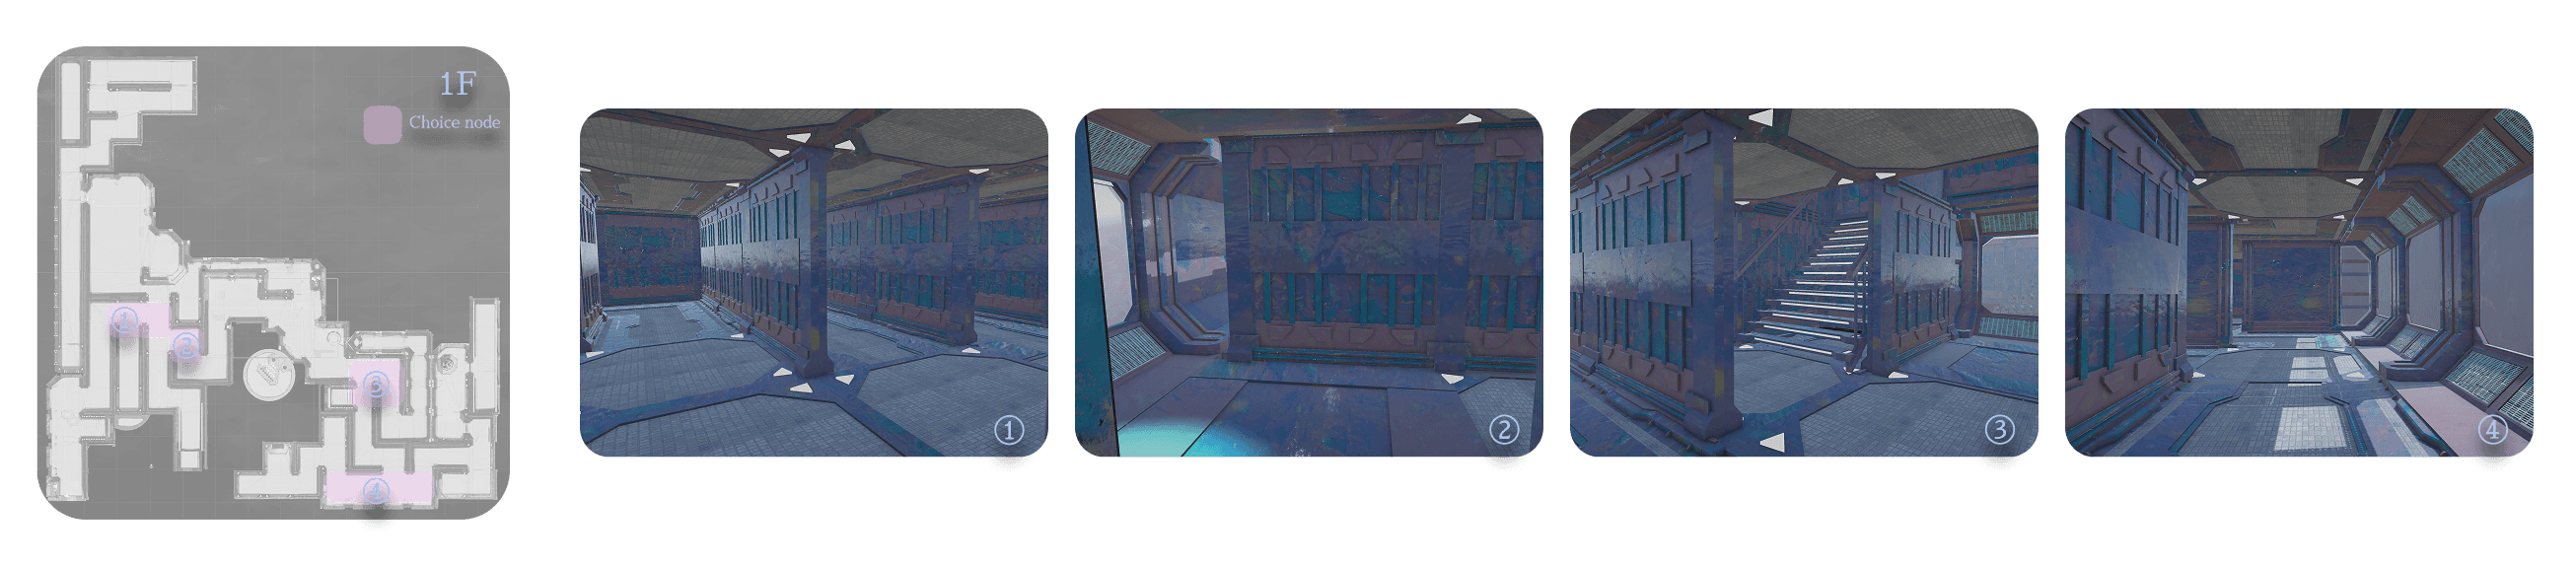
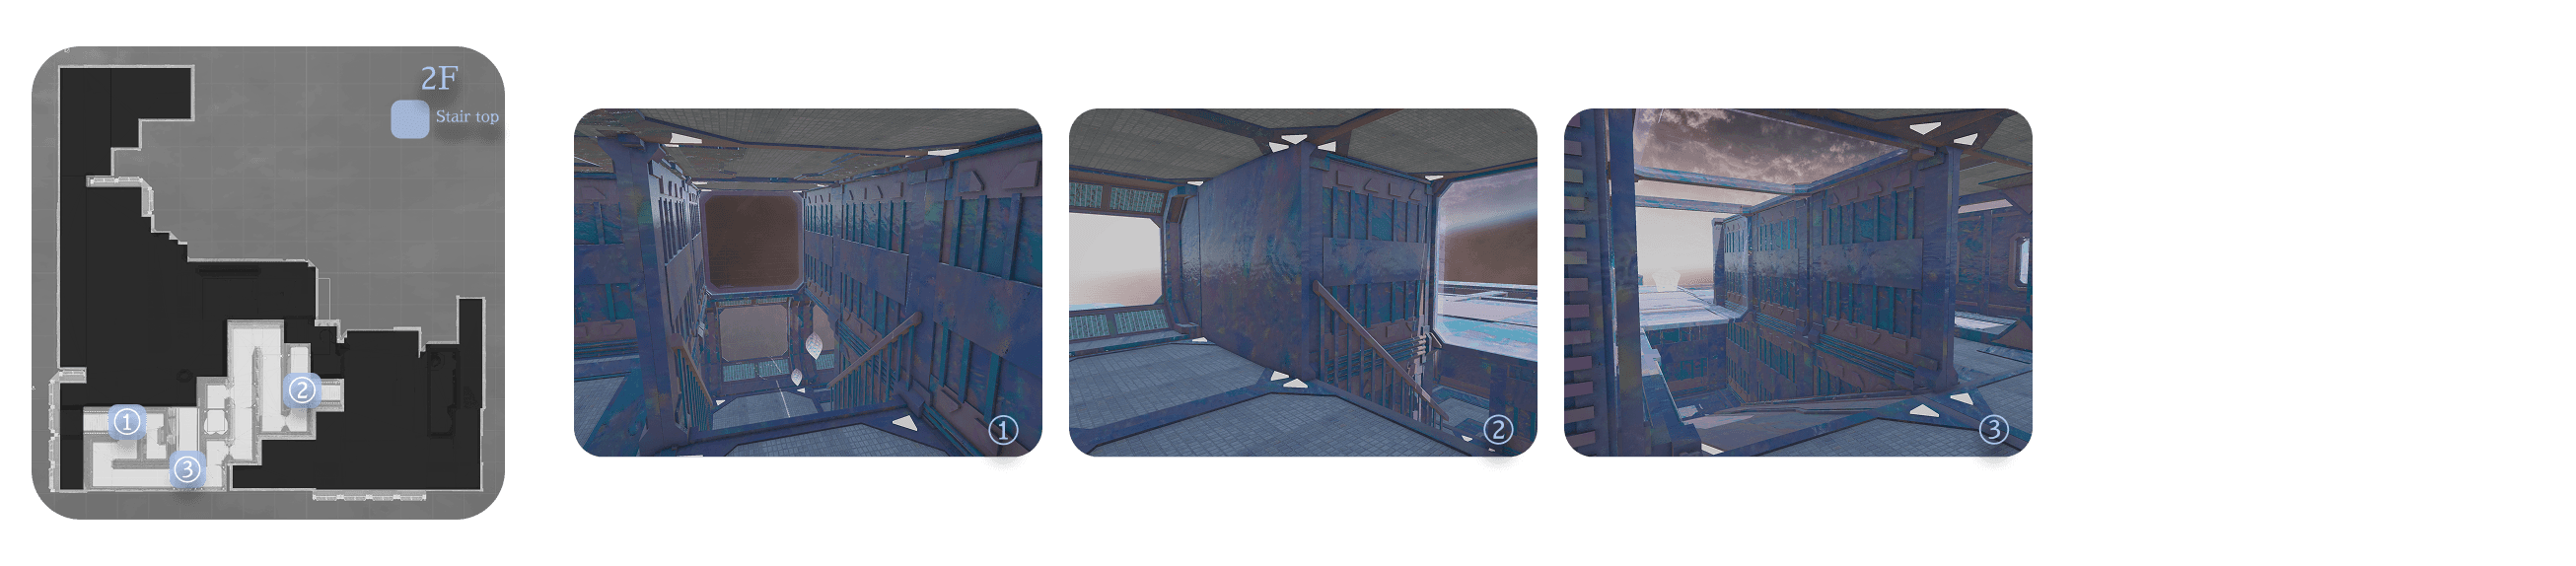
Building upon the three dominant integration vectors identified earlier, the walkable maze is reorganized into a system of eight spatial typologies. These categories translate Taipei Main Station's directional pressures into a modular structure that can be implemented inside Unity. Each typology represents a distinct behavioral expectation: from where crowds enter, to where they slow down, choose routes, or travel vertically between floors.


1F and 2F spatial typology maps dividing the maze into eight behavioral zones—entrance, plaza, main corridor, narrow, side corridor, choice node, stair top, and stair bottom—aligned with the three dominant movement directions identified earlier. The thumbnails below show each typology overlaid on the NavMesh to reveal how these zones distribute across both floors.
To transform these spatial typologies into a living circulation system, each category is assigned a distinct behavioral profile inside Unity—defining how fast agents move, how often they spawn, where they linger, and how they split at decision points. These rules form the foundation of the crowd simulation in the following section.
3-3
Spatial Typologies → In-Engine Spatial Manifestation
The eight spatial typologies are not just abstract categories—they each correspond to a specific architectural pattern inside the Unity prototype. This section maps where each typology appears in the maze and how it feels spatially, using in-engine snapshots taken from key viewpoints.
Landmark Anchors — Supporting Orientation and Spatial Memory
Landmarks are placed in key plazas, junctions, and thresholds to reinforce spatial identity inside the maze. These anchors help players form mental maps, distinguish similar corridors, and read each zone's atmosphere more intuitively.

Landmark objects are placed at key junctions, plazas, and thresholds to strengthen directional cues inside the maze. Just as public art pieces, large advertisements, or iconic shops help travelers orient themselves in Taipei Main Station, these anchors give each zone a distinct identity and make the main routes easier to remember.
3-4
Typology → Behavior Rules
Building upon the three dominant integration vectors identified earlier, the walkable maze is reorganized into a system of eight spatial typologies. These categories translate Taipei Main Station's directional pressures into a modular structure that can be implemented inside Unity. Each typology represents a distinct behavioral expectation: from where crowds enter, to where they slow down, choose routes, or travel vertically between floors.
A neutral base profile is first established to define standard walking behavior. All other typologies are expressed as deviations from this baseline, either faster, slower, denser, or more decision-oriented.

These behavioral parameters directly shape how agents spawn, move, pause, and reroute in the Unity prototype, forming the foundation of the crowd simulation system introduced in Section 3-5.
To verify that the numeric profiles are not only abstract settings, a short top-down simulation of the entire maze was recorded in Unity. The coloured overlays show the eight spatial typologies on 1F and 2F, while thethe agents follow the corresponding spawn, speed, linger, and reroute parameters. On the right, each zone is linked back to its scriptable profile, closing the loop between design table and in-engine behavior.

Top-down snapshot from the Unity prototype, showing agents navigating the zoned maze (left) and the corresponding spawn profiles for each typology (right), linking the behavioral table to in-engine simulation.
3-5
Crowd Simulation Pipeline — From Rules to a Living Crowd
Building on the typology-based rules, the crowd system in Unity is implemented as a staged pipeline. Instead of placing “finished” agents by hand, the simulation is driven by a manager script that continuously spawns, updates, and removes agents based on zone logic.
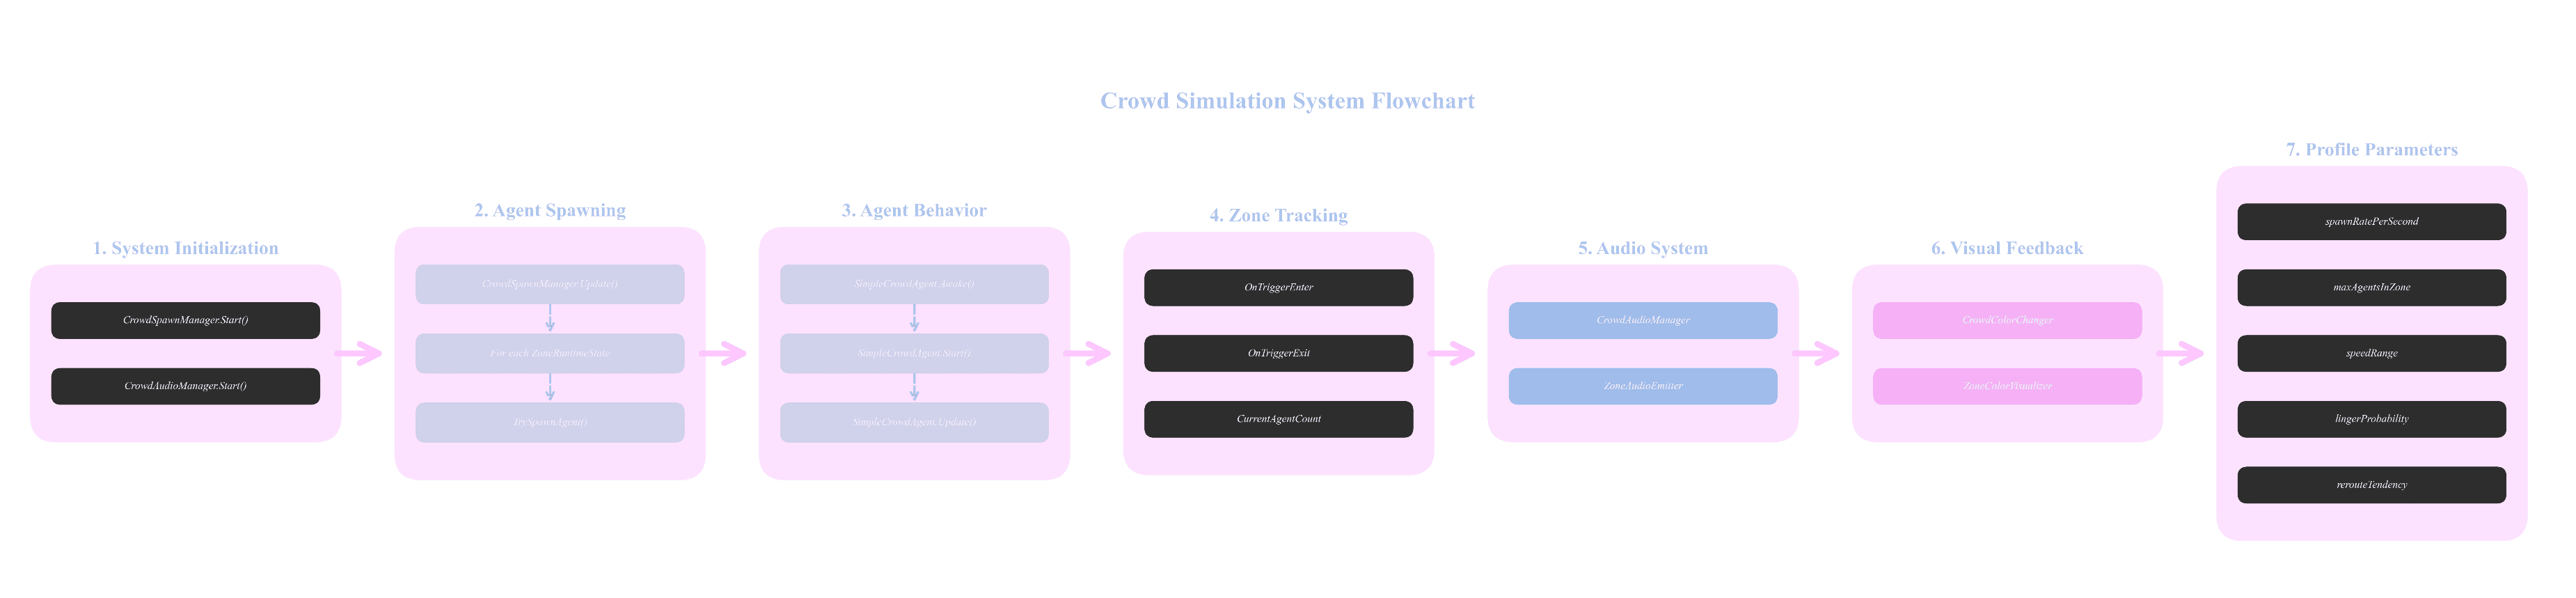
1.System Initialization – A central CrowdSpawnManager and CrowdAudioManager are started at runtime, loading all zone definitions and behavioral profiles.
2.Agent Spawning – For each zone, the manager reads its spawn profile (spawn rate, maximum population, speed range, reroute probability) and instantiates agents over time rather than all at once.
3.Agent Behavior – Each agent samples its parameters from the assigned zone type (eg.“Main Corridor” vs. “Plaza”), which defines how fast it walks, how often it pauses, and how likely it is to change direction at a node.
4.Zone Tracking – Trigger volumes continuously record how many agents are inside each zone and how long they stay, allowing the system to monitor crowd density and directional bias.
5.Audio & Visual Feedback – The same zone data drives ambient sound layers, light intensity, and visual effects. High-density corridors sound and feel busier; quieter side corridors and stair pockets intentionally fall back to a more neutral atmosphere.
6.Profile Parameters – All of these behaviors are controlled by a small set of exposed parameters (spawn per second, speed range, linger probability, reroute tendency), making it possible to tune the whole crowd by adjusting a few sliders instead of rebuilding the scene.
This chapter shifts from designing rules to experiencing their effects. The analyzed station layout now runs as a crowd-aware maze in Unity, populated by agents whose movement follows the three dominant flows identified at Taipei Main Station. Through first-person walkthroughs, VR playtesting, and flow-field recordings, the project examines how these spatial typologies, behavior profiles, and branching paths actually feel when people enter, hesitate, and transfer inside the simulated station.
4-1
First-Person Sampling Map — Walking Through the Maze
To test how the spatial rules actually feel in sequence, participants walked through the maze in first person and captured 16 sampling viewpoints along a typical route. Each numbered point on the map marks a moment where the environment is designed to change: from compressed thresholds to open plazas, from side corridors to narrow tunnels, and from stair pockets to upper-level connectors. Together, these samples show how the three dominant flows from Taipei Main Station translate into a continuous experience of arrival, orientation, and transfer inside the simulated maze.
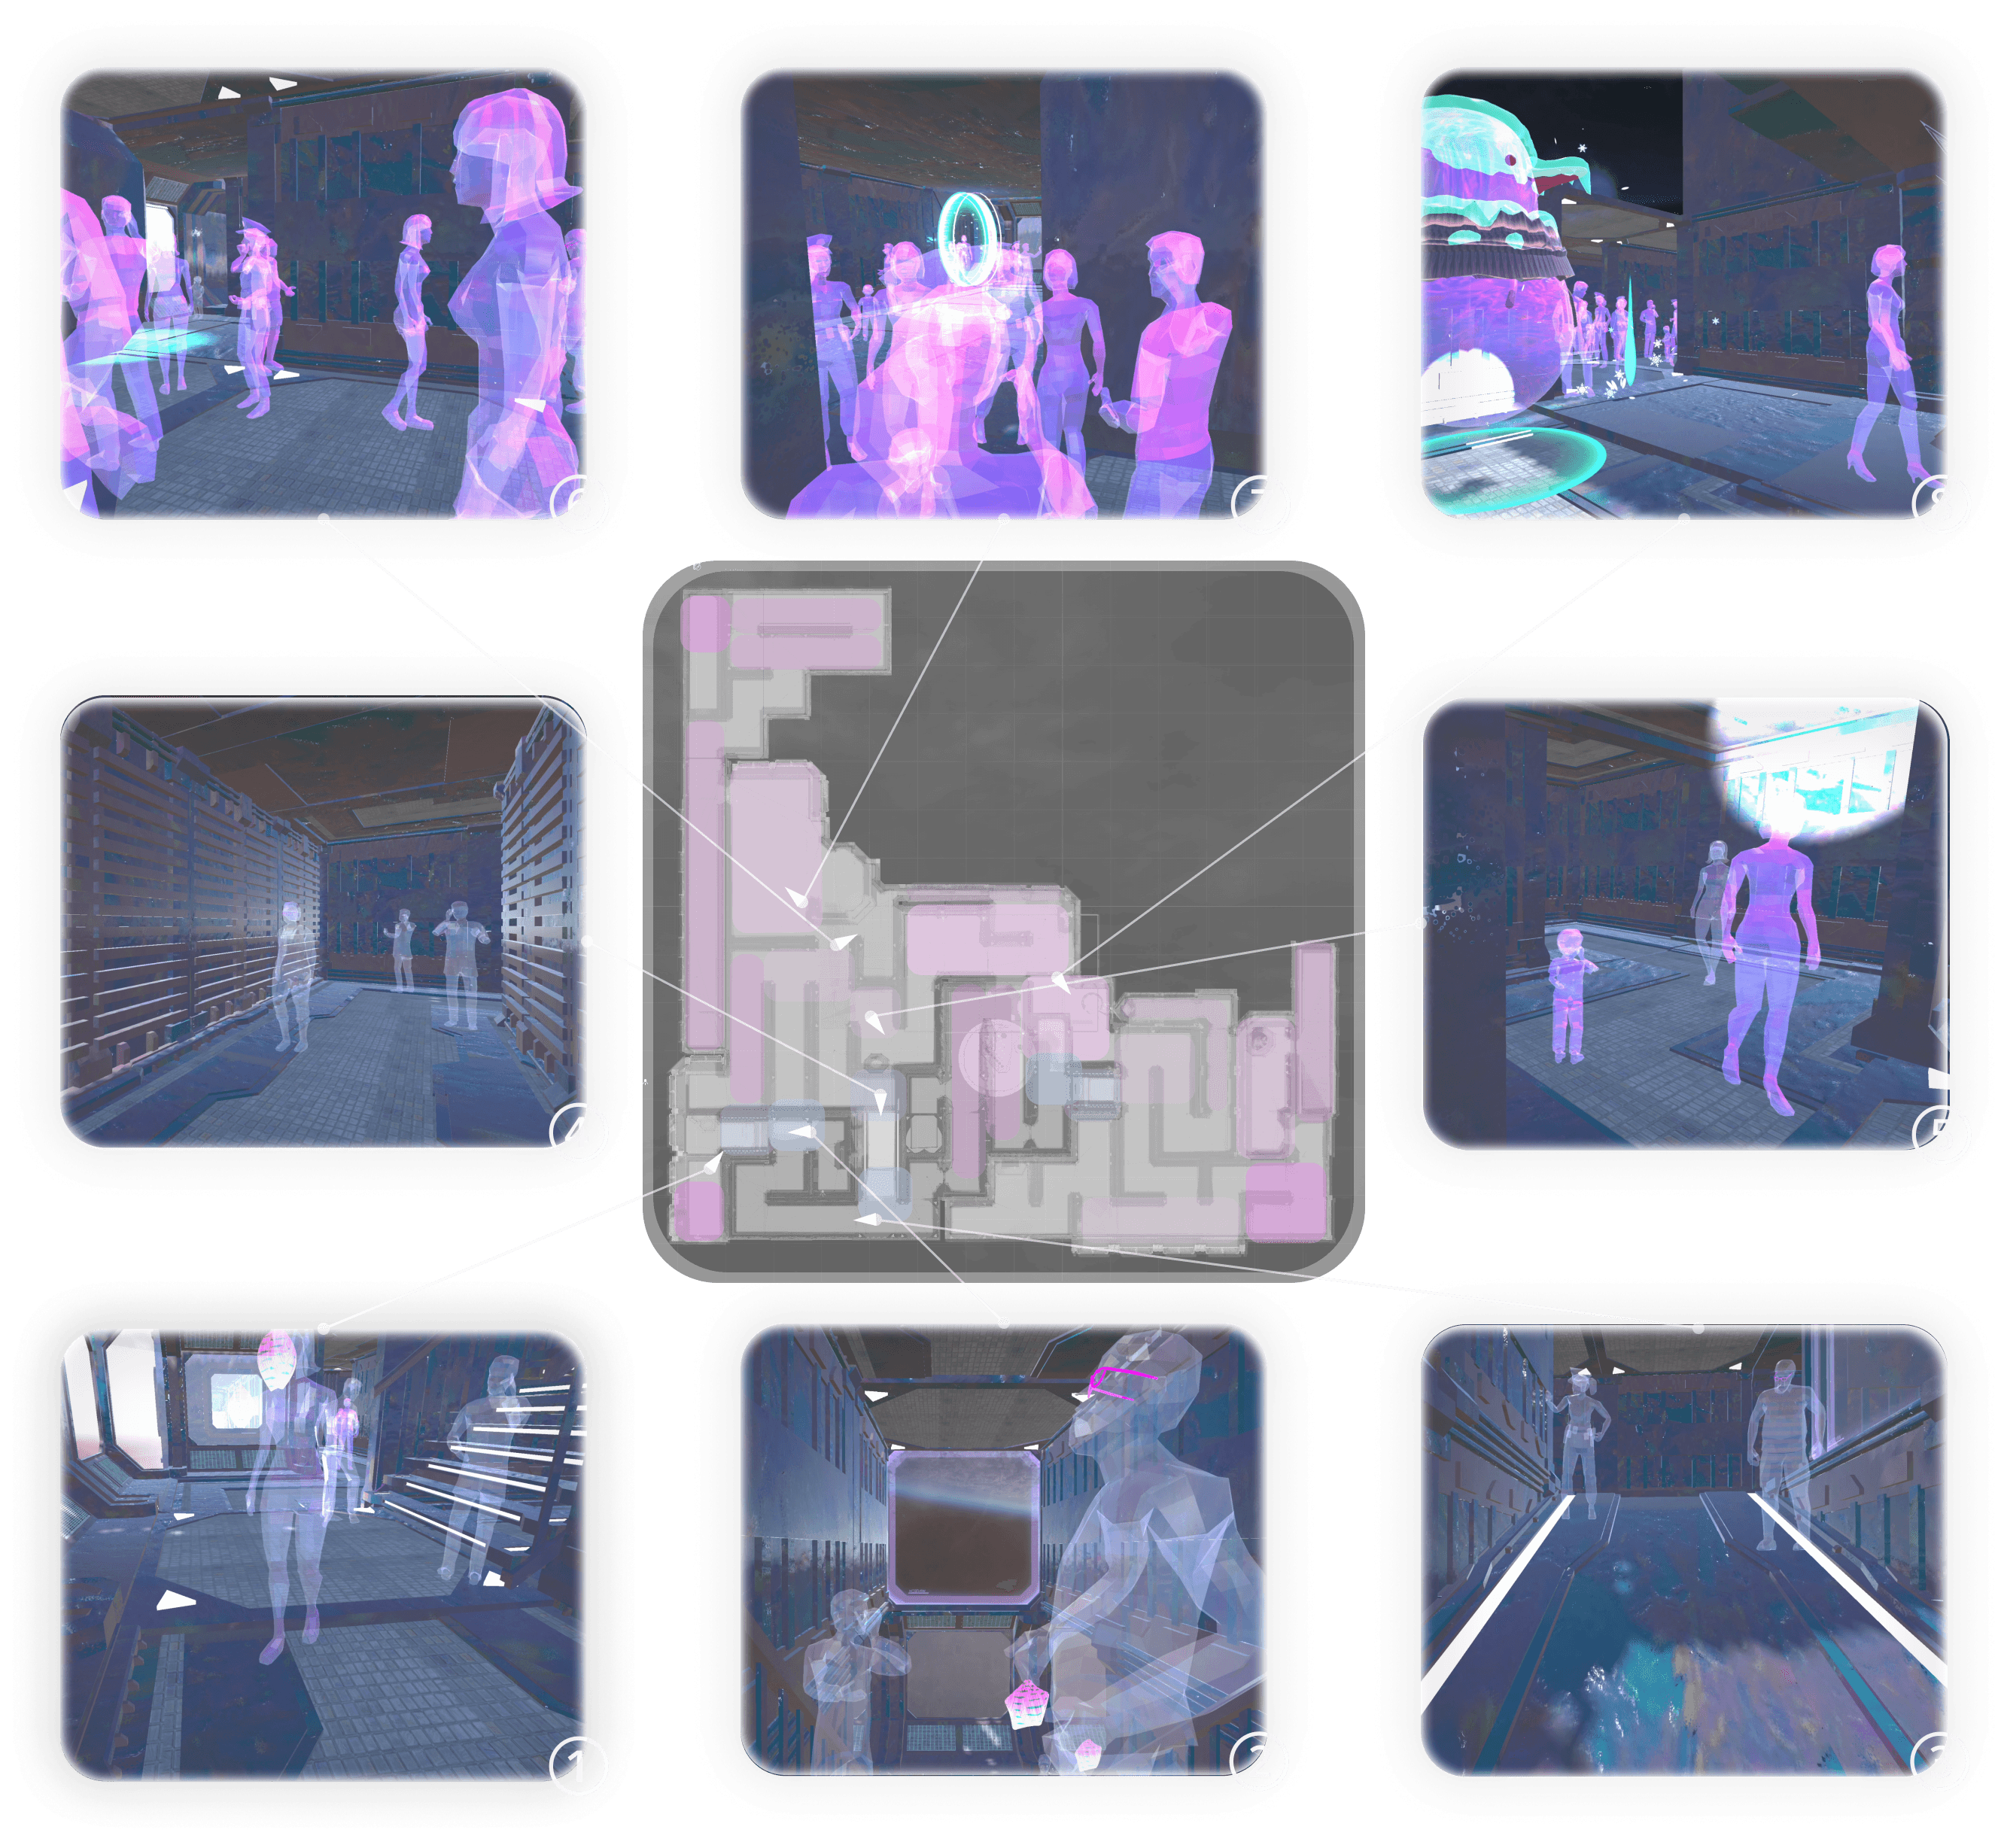

First-person sampling map with 16 viewpoints. Each numbered frame captures how typologies, crowd density, and landmarks combine to build a readable walking rhythm through the simulated station.
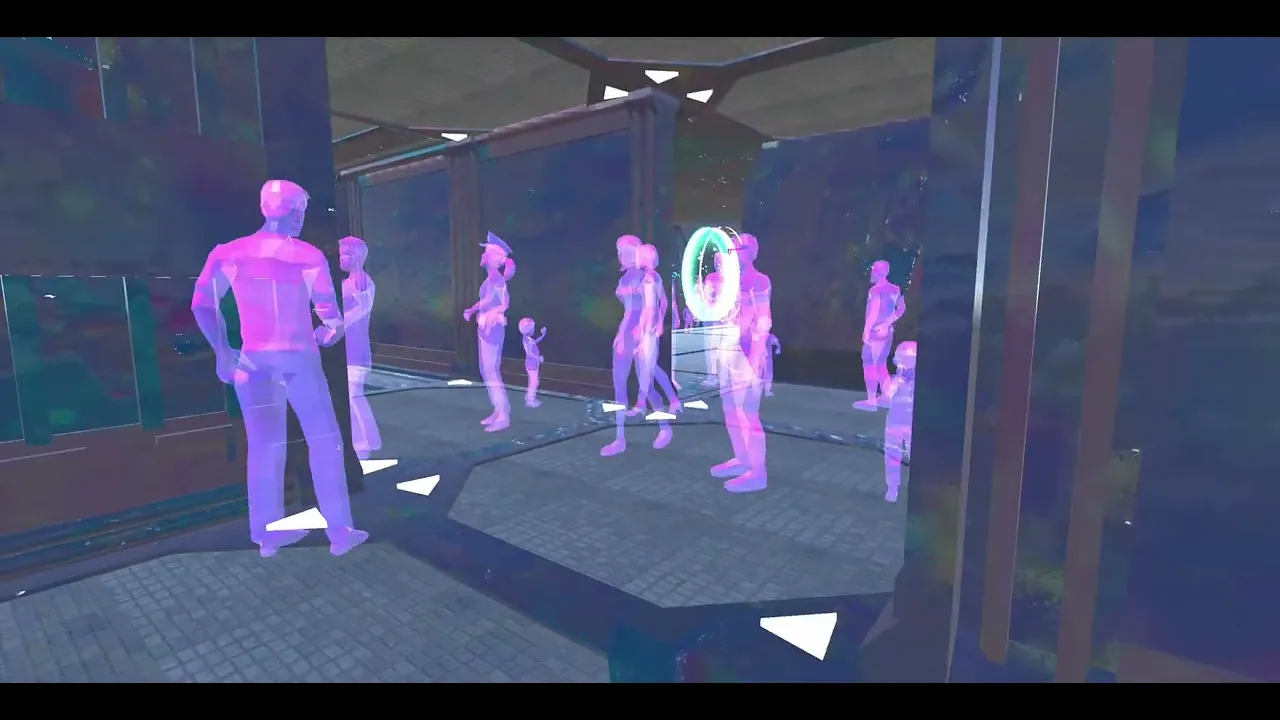
Crowd cues are layered on top of the walkthrough. Visual opacity maps density—more transparent silhouettes mark lighter flows, while saturated ones indicate crowded corridors and nodes. At the same time, ambient sound grows heavier in high-density zones and quieter in side pockets, so the three dominant flows become both visible and audible while walking.

Crowd simulation (Turn on the volume!)
4–2 Crowd Trajectory Mapping(Flow Field Recording)— Interpreting Station-Scale Movement
To examine whether the spatial rules scale up to station-level movement, a peak-hour scenario was simulated in which passengers continuously entered from the “Entrance” zones—mirroring the real conditions of Taipei Main Station during morning and evening rush hours.
In the simulation, each agent stays in the station only for the duration of a typical transfer: some leave quickly, others remain longer depending on their paths and detours. As a result, the map is constantly refreshed with new arrivals while earlier passengers exit the system.

Simulation setup: the full station maze mapped to spawn zones, with CrowdSpawnManager, entrance-biased spawn profiles, and zone-based ambient audio.
To read this flow field at eye level, several hotspots are sampled and compared with their in-engine views. The colored rectangles follow the typology legend—entrance, main corridor, choice node, and stair bottom—so each inset shows not just where people gather, but which spatial role that area plays in the circulation. Together, these snapshots link the abstract trajectory drawing back to concrete situations: queues forming at bottlenecks, crowds compressing before stairs, and streams opening up again once passengers clear decision points.
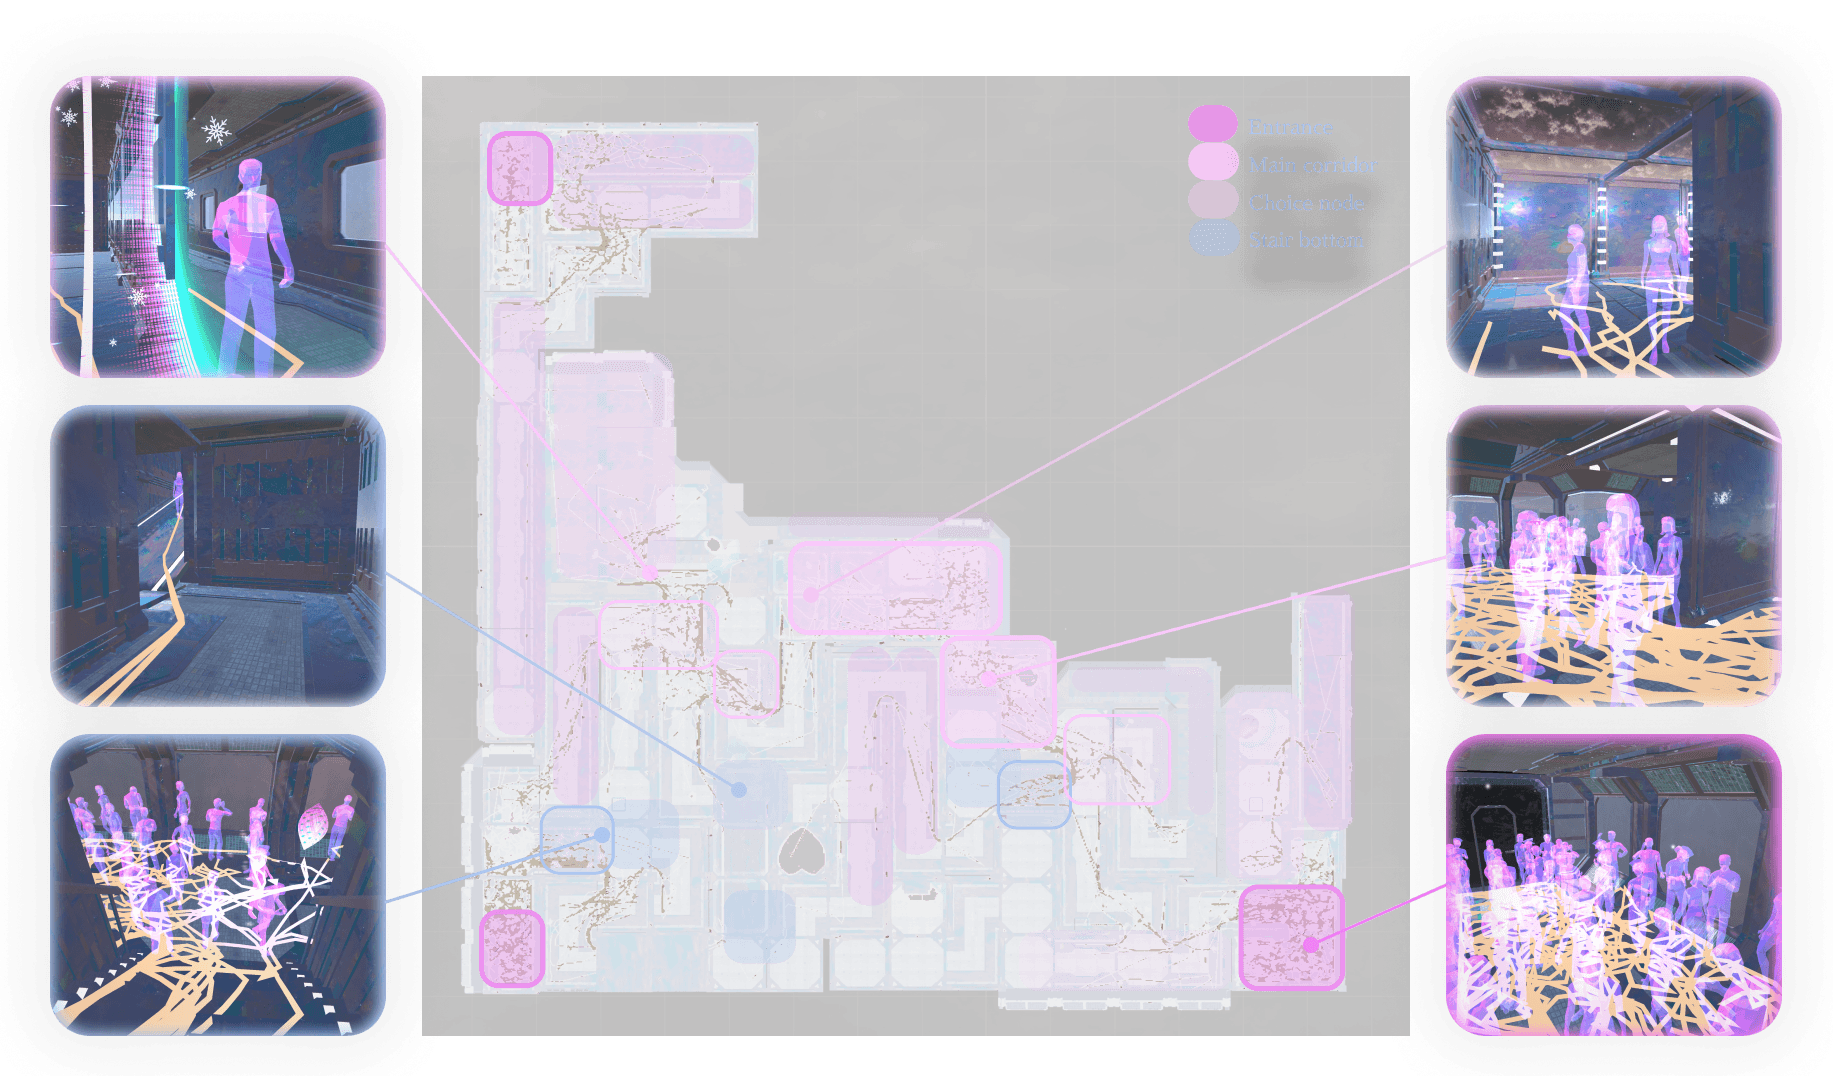
Trajectory overlay from a peak-hour simulation. Agents are injected from the three entrance zones along the main directional axes, so traffic immediately branches into three dominant streams. As new commuters keep entering while others finish their transfers and leave, the overlapping trajectories thicken into a flow field: brighter bundles reveal corridors that carry persistent movement, while faint traces mark occasional shortcuts and rare detours.

Real-world comparison: the densest bundles in the simulated trajectory map align with Taipei Main Station’s actual congestion points—main corridors, stair approaches, transfer halls, and entrance bays. These overlaps show that the rule-based crowd system reproduces the station’s characteristic movement pressure without requiring any hand-scripted paths.